
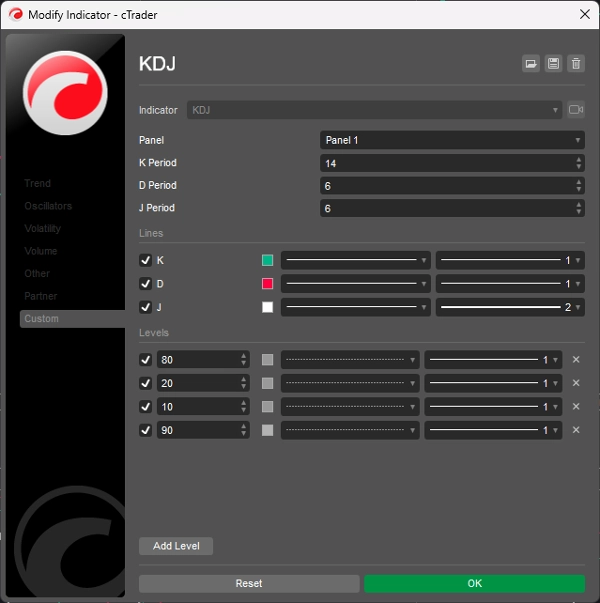
KDJ
Indicador
255 descargas
Versión 1.0, Dec 2024
Windows, Mac
5.0
Valoraciones: 1
Descripción
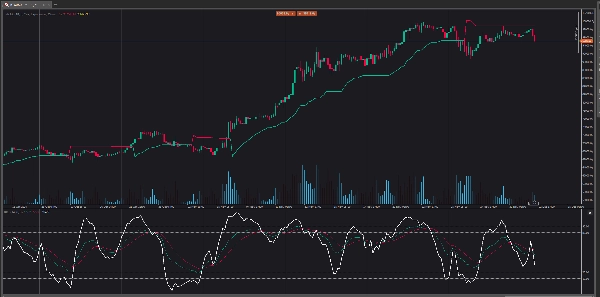
La visualización del oscilador KDJ consta de 3 líneas (K, D y J - de ahí el nombre de la visualización) y 2 niveles. K y D son las mismas líneas que se usan en el oscilador estocástico. La línea J representa la desviación del valor D respecto al valor K. La convergencia de estas líneas indica nuevas oportunidades de trading. Al igual que el oscilador estocástico, los niveles de sobreventa y sobrecompra corresponden a los momentos en que es probable que la tendencia se revierta.
Resumen
Resumen de IA
The KDJ indicator is an oscillator consisting of three lines: K, D, and J, along with two reference levels. The K and D lines correspond to those used in the stochastic oscillator, while the J line measures the deviation of the D value from the K value. This convergence of the three lines is used to identify potential new trading opportunities. Similar to the stochastic oscillator, the KDJ indicator highlights overbought and oversold conditions, which often signal possible trend reversals. This tool is designed to assist traders in timing entries and exits by analyzing momentum and trend strength through these oscillating lines.
Perfil del indicador
Valoraciones de clientes
5.0
Valoraciones: 1
5 | 100 % | |
4 | 0 % | |
3 | 0 % | |
2 | 0 % | |
1 | 0 % |
Valoraciones de clientes
August 18, 2025
Pros: Three-line stochastic oscillator (K, D, J) that identifies overbought/oversold levels and momentum shifts. Supports divergence analysis and crossovers between K and D as trading signals. Lightweight and responsive. Cons: No alerts, tooltips, or settings presets. J‑line can generate outlier v
Conversación
Preguntas frecuentes
Los productos disponibles a través de cTrader Store, incluidos bots, indicadores y plugins para operar, son proporcionados por desarrolladores de terceros y están disponibles únicamente con fines informativos y de acceso técnico. cTrader Store no es un bróker, por lo que no proporciona asesoramiento de inversión, recomendaciones personales ni ninguna garantía de rentabilidad futura.
Más de este autor


Precio
2
Ventas
6.9K
Instalaciones gratis