
3 Bar Triangle by Linda Raschke
مؤشر
536 التنزيلات
الإصدار 1.0، Sep 2024
Windows, Mac
5.0
التقييمات: 1
الوصف
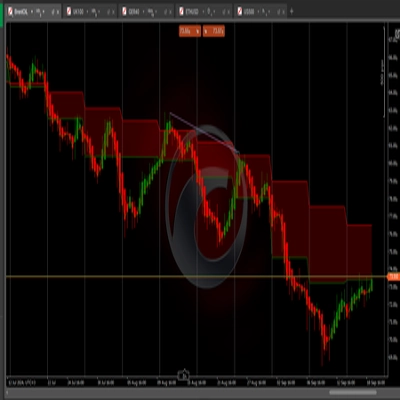
يشير هذا النمط إلى التوحيد أو ضغط السعر، حيث ينكمش السعر ضمن نطاق أضيق. السوق "يتجمع" استعدادًا لاختراق محتمل في أي من الاتجاهين، مما يؤدي عادةً إلى حركة حادة بمجرد اختراقه للمثلث.
تداول الاختراق:
- الدخول: يبحث المتداولون عن اختراق فوق أعلى نقطة في النمط أو تحت أدنى نقطة في النمط، مما يشير إلى اتجاه الحركة التالية.
- وقف الخسارة: وضع وقف خسارة خارج الجانب المقابل للمثلث (إما فوق الأعلى أو تحت الأدنى) يساعد في إدارة المخاطر.
- الأهداف: يهدف بعض المتداولين إلى حركة سعر تساوي حجم المثلث (المسافة بين الأعلى والأدنى للشريط الأول)
الملخص
ملخص الذكاء الاصطناعي
The 3 Bar Triangle indicator by Linda Raschke identifies a consolidation pattern where price contracts within a narrowing range, forming a "triangle" shape over three bars. This pattern signals market "coiling," indicating potential for a sharp breakout in either direction once price moves beyond the triangle boundaries. Traders use this indicator to time entries by watching for a breakout above the pattern’s high or below its low, which suggests the direction of the next price move. Risk management involves placing stop-loss orders just outside the opposite side of the triangle to limit potential losses. Profit targets are often set based on the size of the triangle, aiming for a price movement equal to the distance between the high and low of the initial bar. This indicator supports breakout trading strategies by highlighting periods of price squeezing and potential volatility expansion.
ملف تعريف المؤشر
تقييمات العملاء
5.0
التقييمات: 1
5 | 100 % | |
4 | 0 % | |
3 | 0 % | |
2 | 0 % | |
1 | 0 % |
تقييمات العملاء
August 12, 2025
Pros: Identifies classic 3-bar triangle consolidation zones. Simple setup, visually clear. Stable across timeframes. Cons: No alerts or tooltips. Lacks volume filters and signal confirmation. Limited customization
مناقشة
الأسئلة الشائعة
Breakout
يتم توفير المنتجات المتاحة من خلال cTrader Store، بما في ذلك روبوتات التداول والمؤشرات والإضافات، من قبل مطوري الطرف الثالث وإتاحتها لأغراض الوصول المعلوماتي والفني فقط. cTrader Store ليس وسيطًا ولا يقدم نصائح استثمارية أو توصيات شخصية أو أي ضمان للأداء المستقبلي.
المزيد من هذا المؤلف


السعر
منذ 19/09/2024
314.61K
حجم التداول
258.47K
الربح بالبيب
536
التثبيتات المجانية