MAMA CANDLES
مؤشر
الإصدار 1.0، Sep 2024
Windows, Mac
4.5
التقييمات: 2
الوصف
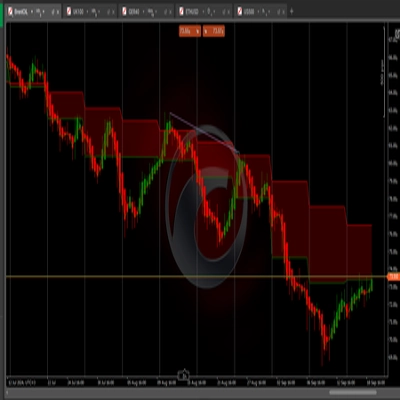
يقوم هذا الكود بتنفيذ مؤشر المتوسط المتحرك التكيفي MESA (MAMA) ، وهو مرشح تكيفي معقد مصمم للاستجابة للدورات وتنعيم بيانات الأسعار. إليك تفصيل لميزاته الرئيسية:
العناصر الرئيسية:
- تحويل هيلبرت: يستخدم المؤشر تحويل هيلبرت لحساب طور الدورة السائدة وفترة سلسلة الأسعار، مما يساعد في تحديد دورة السوق.
- MAMA و FAMA التكيفيان:
-
- MAMA هو المتوسط المتحرك الأسرع الذي يتكيف مع الدورة السائدة.
- FAMA هو المتوسط الأبطأ والأكثر سلاسة.
- يتم رسم كلاهما على الرسم البياني باستخدام ألوان مختلفة.
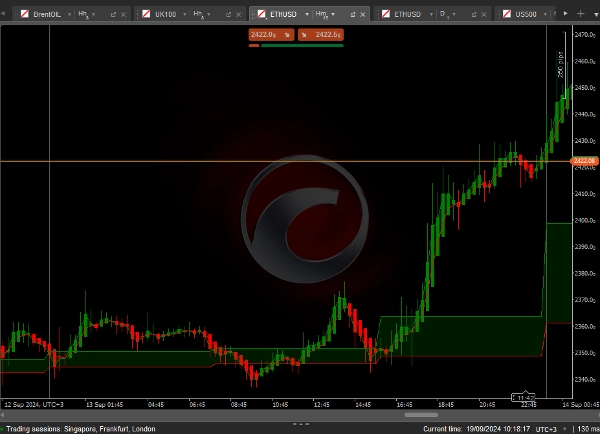
- تلوين الشموع المخصص:
-
- تُلون الشموع باللون الأخضر عندما يكون MAMA فوق FAMA (حالة صعودية).
- تُلون باللون الأحمر عندما يكون MAMA تحت FAMA (حالة هبوطية).
الملخص
ملف تعريف المؤشر
تقييمات العملاء
4.5
التقييمات: 2
5 | 50 % | |
4 | 50 % | |
3 | 0 % | |
2 | 0 % | |
1 | 0 % |
مناقشة
الأسئلة الشائعة
يتم توفير المنتجات المتاحة من خلال cTrader Store، بما في ذلك روبوتات التداول والمؤشرات والإضافات، من قبل مطوري الطرف الثالث وإتاحتها لأغراض الوصول المعلوماتي والفني فقط. cTrader Store ليس وسيطًا ولا يقدم نصائح استثمارية أو توصيات شخصية أو أي ضمان للأداء المستقبلي.
المزيد من هذا المؤلف


السعر
منذ 19/09/2024
314.61K
حجم التداول
258.47K
الربح بالبيب
536
التثبيتات المجانية