
3 Bar Triangle by Linda Raschke
지표
536 다운로드
버전 1.0, Sep 2024
Windows, Mac
5.0
리뷰: 1
설명
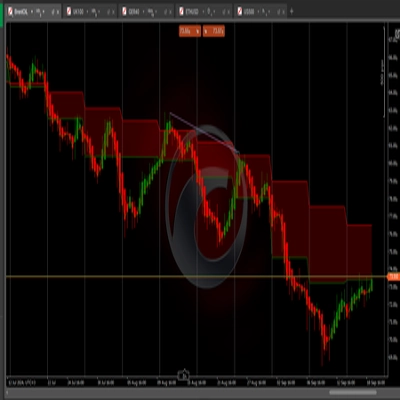
이 패턴은 통합 또는 가격 압축을 나타내며, 가격이 더 좁은 범위 내에서 수축하고 있음을 의미합니다. 시장은 잠재적인 돌파를 위해 "코일링"되고 있으며, 일반적으로 삼각형을 돌파할 때 급격한 움직임으로 이어집니다.
돌파 거래:
- 진입: 트레이더들은 다음 움직임의 방향을 나타내는 패턴의 최고점 위나 최저점 아래에서의 돌파를 찾습니다.
- 손절매: 삼각형의 반대편 바깥(최고점 위 또는 최저점 아래)에 손절매를 설정하여 위험을 관리합니다.
- 목표: 일부 트레이더들은 가격 움직임을 삼각형 크기(첫 번째 바의 최고점과 최저점 사이 거리)와 같게 목표로 삼습니다.
요약
AI 요약
The 3 Bar Triangle indicator by Linda Raschke identifies a consolidation pattern where price contracts within a narrowing range, forming a "triangle" shape over three bars. This pattern signals market "coiling," indicating potential for a sharp breakout in either direction once price moves beyond the triangle boundaries. Traders use this indicator to time entries by watching for a breakout above the pattern’s high or below its low, which suggests the direction of the next price move. Risk management involves placing stop-loss orders just outside the opposite side of the triangle to limit potential losses. Profit targets are often set based on the size of the triangle, aiming for a price movement equal to the distance between the high and low of the initial bar. This indicator supports breakout trading strategies by highlighting periods of price squeezing and potential volatility expansion.
지표 프로필
고객 리뷰
5.0
리뷰: 1
5 | 100 % | |
4 | 0 % | |
3 | 0 % | |
2 | 0 % | |
1 | 0 % |
고객 리뷰
August 12, 2025
Pros: Identifies classic 3-bar triangle consolidation zones. Simple setup, visually clear. Stable across timeframes. Cons: No alerts or tooltips. Lacks volume filters and signal confirmation. Limited customization
상담
자주 묻는 질문(FAQ)
Breakout
트레이딩 봇, 지표, 플러그인 등 cTrader Store에서 제공되는 상품은 제3자 개발자에 의해 제공되며, 이는 단순히 정보 및 기술적 접근을 목적으로 제공된 것입니다. cTrader Store는 중개인이 아니며, 투자 조언, 개인별 추천 또는 향후 성과에 대한 어떠한 보장도 제공하지 않습니다.
이 작성자의 상품 더 보기


가격
가입일 19/09/2024
314.61K
거래량
258.47K
핍 수익
536
무료 설치