present
Zarejestruj się i otrzymaj 50 $ zniżki na pierwszy zakup
Trading product for MAMA CANDLES Wskaźnik, image 1
MAMA CANDLES
Wskaźnik
Wersja 1.0, Sep 2024
Windows, Mac
4.5
Opinie: 2
Trading product for MAMA CANDLES Wskaźnik, image 2
Od 19/09/2024
314.61K
Wolumen transakcji
258.47K
Zysk w pipsach
571
Bezpłatne instalacje

Opis

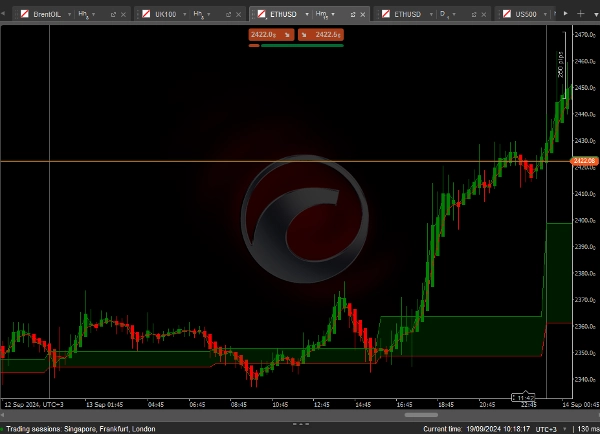
Ten kod implementuje wskaźnik MESA Adaptive Moving Average (MAMA) indykator, złożony filtr adaptacyjny zaprojektowany do reagowania na cykle i wygładzania danych cenowych. Oto przegląd jego kluczowych cech:

Kluczowe elementy:

  1. Transformata Hilberta: Wskaźnik wykorzystuje transformację Hilberta do obliczenia dominującej fazy cyklu i okresu serii cenowej, co pomaga w identyfikacji cyklu rynkowego.
  2. Adaptacyjne MAMA i FAMA:
    • MAMA to szybsza średnia krocząca, która dostosowuje się do dominującego cyklu.
    • FAMA to gładsza, wolniejsza średnia.
    • Obie są wykreślane na wykresie przy użyciu różnych kolorów.
  3. Niestandardowe kolorowanie świec:
    • Świece są kolorowane na zielono, gdy MAMA jest powyżej FAMA (warunek byczy).
    • Są kolorowane na czerwono, gdy MAMA jest poniżej FAMA (warunek niedźwiedzi).

Podsumowanie

Podsumowanie AI
MAMA CANDLES is an indicator implementing the MESA Adaptive Moving Average (MAMA), designed to adaptively smooth price data by responding to market cycles. It uses a Hilbert Transform to identify the dominant cycle phase and period within the price series. The indicator calculates two moving averages: MAMA, a faster average that adapts to the dominant cycle, and FAMA, a slower, smoother average. Both averages are plotted on the chart with distinct colors. Additionally, candlesticks are custom-colored based on the relationship between MAMA and FAMA: green when MAMA is above FAMA indicating bullish conditions, and red when MAMA is below FAMA indicating bearish conditions. This visualization aids in identifying trend direction and market cycle phases.
Profil wskaźnika

Dyskusja

Opinie klientów

4.5
Opinie: 2
5
50 %
4
50 %
3
0 %
2
0 %
1
0 %
Opinie klientów
October 4, 2024
September 23, 2024

Częste pytania

Produkty dostępne za pośrednictwem cTrader Store, w tym boty handlowe, wskaźniki i wtyczki, dostarczane są przez deweloperów zewnętrznych i udostępniane wyłącznie w celach informacyjnych oraz w celu zapewnienia dostępu technicznego. cTrader Store nie jest brokerem i nie zapewnia doradztwa inwestycyjnego, nie udziela spersonalizowanych rekomendacji ani nie gwarantuje przyszłych wyników.

Więcej od tego autora
Wskaźnik
Breakout
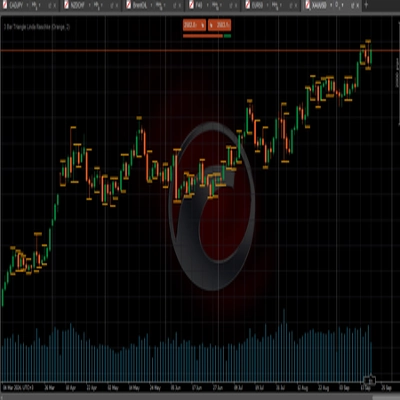
3 bar triangle = high below 2 day high, low above 2 day low
Wskaźnik
Forex
Signal
A powerful trend-following indicator that combines multi-timeframe analysis with advanced cycle filtering to generate re

Możesz także polubić

Wskaźnik
SMC
Breakout
+1
Delta Peak Bubbles is a tick‑chart overlay for cTrader that highlights the strongest momentum spikes.
Wskaźnik
ATR
RSI
+5
Multi-timeframe trend indicator using EMA, MACD & ADX to confirm high-probability buy and sell bias.
Wskaźnik
ATR
RSI
+5
One of the best indicators we have ever developed, with a very high profit ratio.
Wskaźnik
AI
ATR
+27
Market Cipher B
Wskaźnik
Key Levels
Trend-filtered signals, transparent trade plans and a multi-timeframe decision panel for cTrader.
Wskaźnik
Volume
Key Levels
+2
Professional Session Volume Profile for cTrader with POC, Value Area, naked levels and rich HUD.
Wskaźnik
AI
RSI
+7
Multi-asset screener with real-time RSI/volatility analysis, interactive dashboard, and color-coded trading signals.
Wskaźnik
ATR
Key Levels
+1
Explore 88 harmonic price-pattern variants with interactive chart controls and geometric reference levels.
Wskaźnik
SMC
Forex
+5
Silver Bullet by LudwigICT
Wskaźnik
Volume
Support & Resistance
Compare up to 27 symbols across eight timeframes with seven analysis engines and an interactive cTrader dashboard.
Wskaźnik
[Hamster-Coder] Pivot Points (Multi Time Frame)
Wskaźnik
RSI
Forex
+10
Unlock Stochastic RSI PRO in cTrader! Overlay RSI, highlight zones, and identify divergences with customizable settings.
Wskaźnik
Forex
BTCUSD
+5
Daily/Weekly/Monthly - Highs & Lows Indicator (Customizable Settings)
Wskaźnik
Risk Dashboard
AI-powered daily range forecasts help traders spot volatility opportunities and plan stops and targets.
Wskaźnik
ATR
BOS
+5
Market structure with BOS and CHoCH, order blocks, and retest buy/sell arrows with entry, stop and two targets
Wskaźnik
VWAP
Volume
+3
Don't trust static support and resistance levels, this indicator combines Fibonacci and VWAP in one powerful tool.
Logo „ZigXRay”
Najwyżej oceniane
4.6
(5)
$29
/
$49
Wskaźnik
CHOCH
Key Levels
+5
ZigZag Market Structure Identifier - Multi-Layer Scanner: Convergent Pivot Detection, 4-TF Overlay & Naked Chart Mode.
Wskaźnik
Volume
Order Block
+3
Map market structure, order blocks, liquidity and key zones with an interactive cTrader dashboard.

Cena

Od 19/09/2024
314.61K
Wolumen transakcji
258.47K
Zysk w pipsach
571
Bezpłatne instalacje