
3 Bar Triangle by Linda Raschke
Indicator
540 downloads
Version 1.0, Sep 2024
Windows, Mac
5.0
Reviews: 1
Description
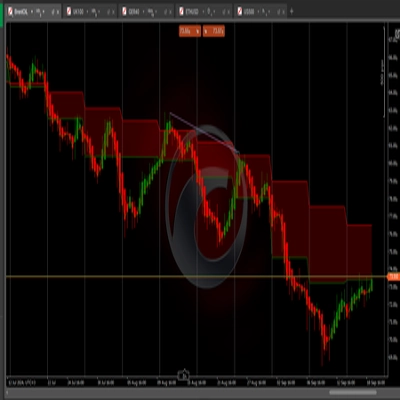
This pattern suggests consolidation or price squeezing, where price is contracting within a tighter range. The market is "coiling" up for a potential breakout in either direction, typically leading to a sharp movement once it breaks out of the triangle.
Trading the Breakout:
- Entry: Traders look for a breakout above the high of the pattern or below the low of the pattern, indicating the direction of the next move.
- Stop-loss: Placing a stop-loss outside the opposite side of the triangle (either above the high or below the low) helps manage risk.
- Targets: Some traders aim for a price move equal to the size of the triangle (the distance between the high and low of the first bar)
Summary
AI summary
The 3 Bar Triangle indicator by Linda Raschke identifies a consolidation pattern where price contracts within a narrowing range, forming a "triangle" shape over three bars. This pattern signals market "coiling," indicating potential for a sharp breakout in either direction once price moves beyond the triangle boundaries. Traders use this indicator to time entries by watching for a breakout above the pattern’s high or below its low, which suggests the direction of the next price move. Risk management involves placing stop-loss orders just outside the opposite side of the triangle to limit potential losses. Profit targets are often set based on the size of the triangle, aiming for a price movement equal to the distance between the high and low of the initial bar. This indicator supports breakout trading strategies by highlighting periods of price squeezing and potential volatility expansion.
Indicator profile
Customer reviews
5.0
Reviews: 1
5 | 100 % | |
4 | 0 % | |
3 | 0 % | |
2 | 0 % | |
1 | 0 % |
Customer reviews
August 12, 2025
Pros: Identifies classic 3-bar triangle consolidation zones. Simple setup, visually clear. Stable across timeframes. Cons: No alerts or tooltips. Lacks volume filters and signal confirmation. Limited customization
Discussion
FAQ
Breakout
Products available through cTrader Store, including trading bots, indicators and plugins, are provided by third-party developers and made available for informational and technical access purposes only. cTrader Store is not a broker and does not provide investment advice, personal recommendations or any guarantee of future performance.
More from this author


!["High-Low Divergence [Iridio Capital]" logo](https://cdn.ctrader.com/image/webp/443c4661-7abb-40f1-842f-4b6ec560649b_40914)


Price
Since 19/09/2024
314.61K
Traded volume
258.47K
Pips won
540
Free installs