Deskripsi
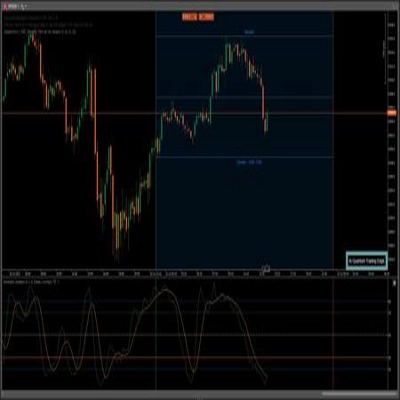
Indikator Toko Pinescriptlabs: cBot Toko Pinescriptlabs : (cBot) Gold & BTC BreakoutSession Pivots(baru)
Struktur Pasar Lanjutan: Bos, Choch, SwinLevels, Order Blocks, Pencari Struktur Pasar & Likuiditas (Baru)
Proyeksi Likuiditas Harga ZigZag
Algoritma Pintar Trailing (baru)
Prediksi Berdasarkan Linreg & ATR
SmartTrend Dukungan &
Perlawanan
Garis
Analisis
Struktur Pasar
Dinamis
dari
Titik
Pembalikan
Fibonacci
Regresi
Linear
Multi-timeframe
Pelacak
Bias Lilin
Multi-Level
Dukungan
dan Perlawanan
Otomatis
Garis Tren
Garis
Semua
Dukungan dan
Perlawanan
Level
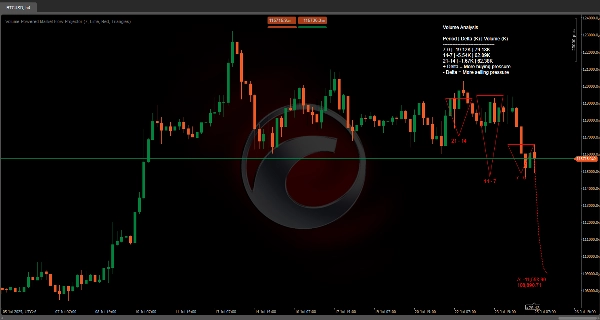
📊 Proyeksi Aliran Pasar:
Indikator FutureTrend dirancang untuk menganalisis dan memproyeksikan perilaku pasar secara dinamis dengan mengintegrasikan data harga dan volume di berbagai dimensi waktu. Fungsi utamanya meliputi:
⏳ Analisis Tiga Periode
📈 Menghitung harga rata-rata (tertinggi dan terendah) serta volume delta (perbedaan antara tekanan beli dan jual) di tiga periode berturut-turut yang ditentukan oleh parameter Period.
🔍 Tampilan terkonsolidasi dari pergerakan historis ini membantu mengidentifikasi tren dominan dan pergeseran perilaku pasar.
🚀 Proyeksi Garis Tren Masa Depan
📊 Dengan menggunakan rata-rata tertimbang dari volume delta dari tiga periode yang dianalisis, indikator memproyeksikan garis tren masa depan yang mencerminkan kemungkinan arah pasar.
🛠️ Proyeksi ini disesuaikan secara dinamis menggunakan faktor pelunakan untuk menghindari prediksi ekstrem.
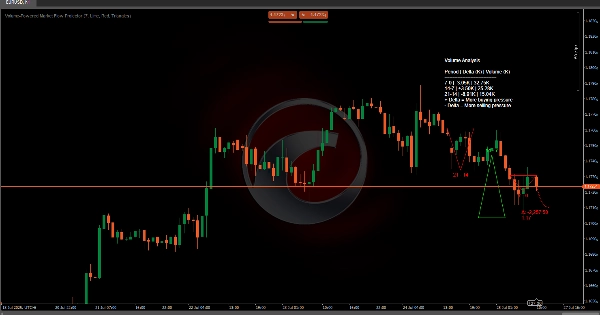
🔷 Representasi Visual Bentuk
🎨 Data historis direpresentasikan secara visual melalui bentuk geometris (segitiga, lingkaran, atau kotak) yang menggambarkan evolusi volume dan rentang harga untuk setiap periode.
🔴🟢 Warna yang ditetapkan (UpColor dan DownColor) menunjukkan tren yang berlaku (bullish atau bearish), memungkinkan interpretasi cepat.
🏷️ Rata-rata Volume Delta & Label Harga Masa Depan
📍 Di akhir garis tren yang diproyeksikan, sebuah label menampilkan rata-rata volume delta dan perkiraan harga masa depan, memberikan referensi utama untuk potensi pergerakan harga dan kekuatan tren.
📋 Tabel Data Volume
📑 Menyediakan tabel terperinci yang memecah total volume dan perbedaan delta untuk tiga periode yang dianalisis.
📊 Ini memungkinkan trader untuk dengan cepat membandingkan data volume, menginterpretasikan konteks pasar, dan mendukung proyeksi tren masa depan.
🔮 Arah
Dengan menggabungkan volume dan data harga, indikator ini menawarkan alat yang kuat untuk memprediksi kekuatan tren dan potensi pergeseran perilaku pasar selama periode mendatang.
Ringkasan
The indicator projects a future trendline based on a weighted average of delta volumes from the analyzed periods, dynamically adjusted with smoothing factors to prevent extreme predictions. Historical data is visually represented using geometric shapes—such as triangles, circles, or boxes—that illustrate volume and price range evolution for each period. Colors indicate prevailing trends, with distinct hues for bullish and bearish conditions.
At the end of the projected trendline, a label displays the average delta volume and estimated future price, providing a reference for potential price movements and trend strength. Additionally, a detailed volume data table breaks down total volumes and delta differences for the three periods, supporting market context interpretation and trend projection. By combining volume and price data, this tool aids in predicting trend strength and potential market behavior shifts.
Ulasan pelanggan
5 | 100 % | |
4 | 0 % | |
3 | 0 % | |
2 | 0 % | |
1 | 0 % |