present
Regístrese y obtenga 50 $ de descuento en su primera compra
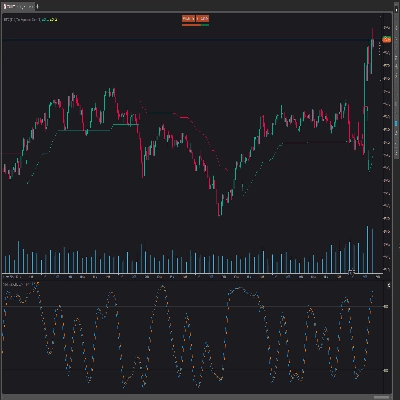
Trading product for Machine Learning Momentum Index Indicador Indices AI, image 1
Machine Learning Momentum Index
4.5
Valoraciones: 2
2
Ventas
7.31K
Instalaciones gratis

Descripción

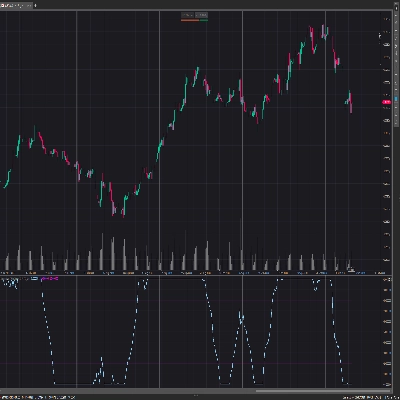
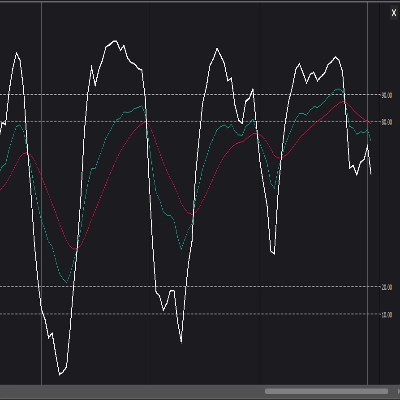
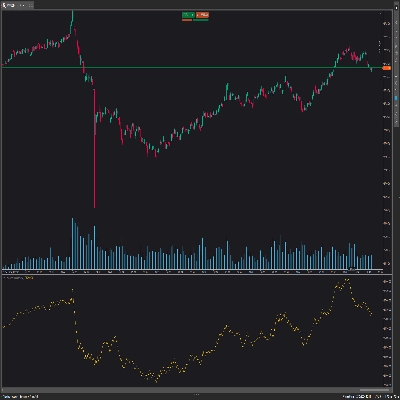
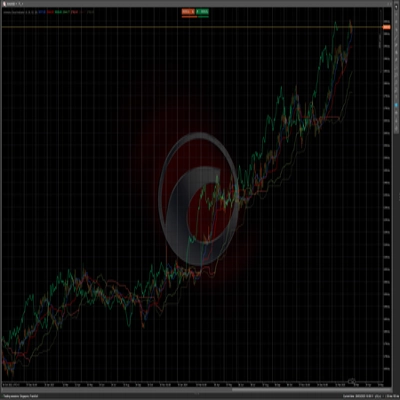
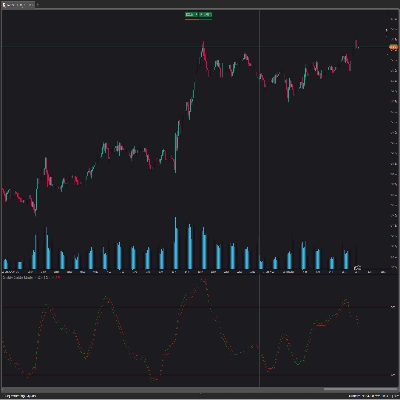
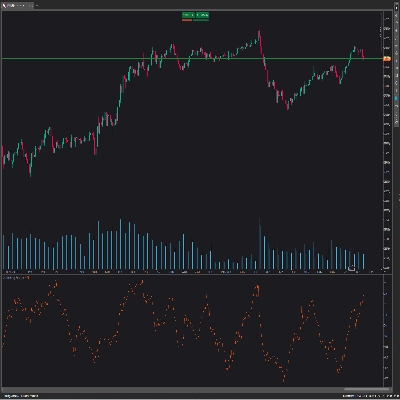
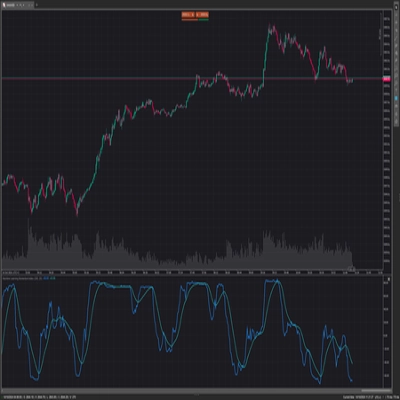
El Índice de Momentum de Aprendizaje Automático (MLMI) representa el siguiente paso en el trading con osciladores. Al combinar el análisis tradicional de momentum con el aprendizaje automático, MLMI ofrece una herramienta potente y dinámica que se adapta a las complejidades de los paisajes financieros modernos. Ofreciendo a los traders una forma adaptativa de entender y actuar sobre el momentum y las tendencias del mercado, este oscilador proporciona información en tiempo real sobre el momentum del mercado y las tendencias predominantes

Resumen

Resumen de IA
The Machine Learning Momentum Index (MLMI) is an advanced oscillator that integrates traditional momentum analysis with machine learning techniques. Designed to provide real-time insights, MLMI helps traders assess market momentum and identify prevailing trends dynamically. By adapting to the complexities of modern financial markets, this indicator offers an enhanced approach to momentum trading. It is applicable across various indices, including Nasdaq, S&P 500, DAX, and Dow, supporting traders in making informed decisions based on evolving market conditions.
Perfil del indicador

Conversación

Valoraciones de clientes

4.5
Valoraciones: 2
5
50 %
4
50 %
3
0 %
2
0 %
1
0 %
Valoraciones de clientes
July 9, 2025
Pros: Combines RSI-based WMAs and k‑NN machine learning for adaptive momentum detection. Highlights trend changes and consolidation zones. Cons: No alerts or tooltips. Less effective on higher timeframes. Requires other confirmation tools to trade reliably.
April 26, 2025
Accuracy

Preguntas frecuentes

Indices
AI
Los productos disponibles a través de cTrader Store, incluidos bots, indicadores y plugins para operar, son proporcionados por desarrolladores de terceros y están disponibles únicamente con fines informativos y de acceso técnico. cTrader Store no es un bróker, por lo que no proporciona asesoramiento de inversión, recomendaciones personales ni ninguna garantía de rentabilidad futura.

Más de este autor
Logotipo de "PMAX"
5.0
(6)
Gratis
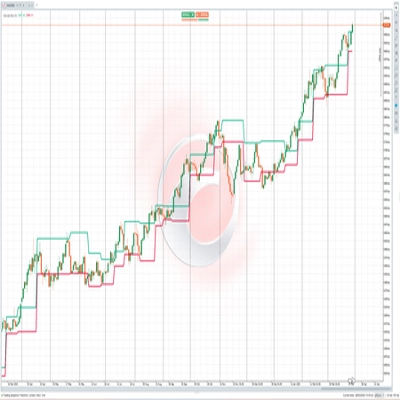
It's a combination of two trailing stop loss and the other one is well-known ATR-based SuperTrend.
Stochastic RSI (StochRSI) is a technical indicator used to measure the strength and weakness of the RSI.
Laguerre RSI is based on John EHLERS' Laguerre Filter to avoid the noise of RSI.
The KDJ oscillator display consists of 3 lines (K, D and J - hence the name of the display) and 2 levels.
The Darvas Box involves identifying "boxes" or trading ranges where a stock's price consolidates before breaking out.
On Balance Volume (OBV) measures buying and selling pressure as a cumulative indicator.
The Ichimoku Cloud is a comprehensive technical analysis system developed by Japanese journalist Goichi Hosoda
The QQE (Quantitative Qualitative Estimation) Weighted Oscillator improves its original version by weighting the RSI.
Chaikin money flow's primary purpose is to distinguish between periods of accumulation and distribution of a security.

Puede interesarle

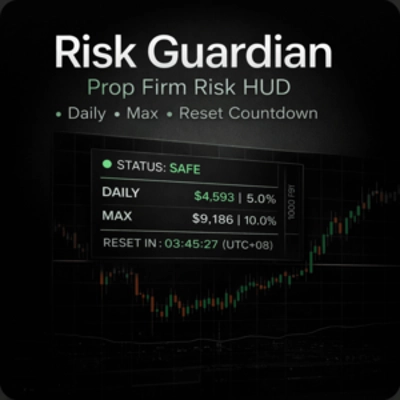
A clean, real-time risk HUD designed to prevent prop firm account failure and protect your challenge account.
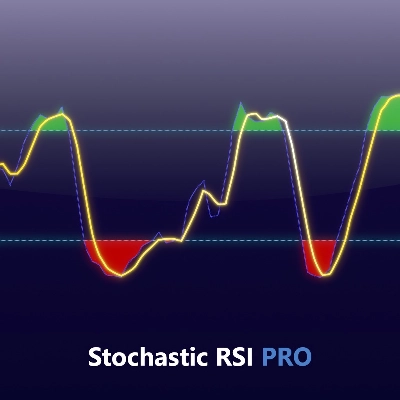
Unlock Stochastic RSI PRO in cTrader! Overlay RSI, highlight zones, and identify divergences with customizable settings.
VWAP Bands indicator with 3 standard deviation levels, buy/sell zones, and a draggable ON/OFF button to toggle the entir
Pro Heikin Ashi Visual Overlay – Clean Trend Visualization
Add Slowing to IR Moving Average.
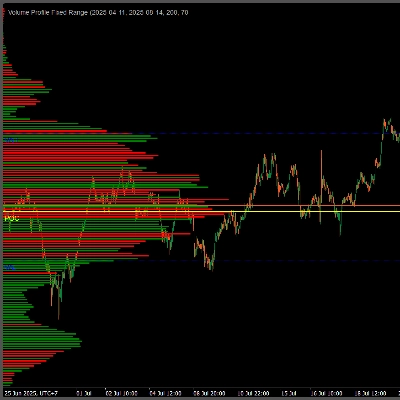
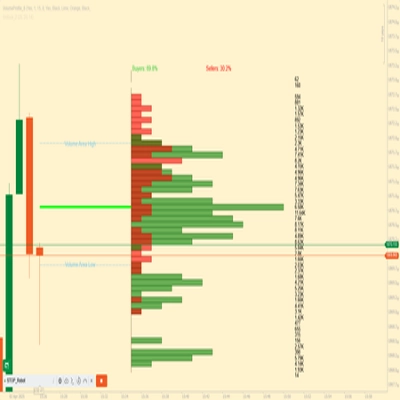
Professional Volume Profile Indicator - Shows volume distribution, POC, Value Areas & Buy/Sell pressure.
Scalpers Volume Profile
Fractal Arrow Buy and Sell Indicator
Logotipo de "MA Sabres"
4.2
(4)
$19
Conquer the markets with MA Sabres! This indicator spots trend flips with MAs and cool Sabre shapes & alerts.
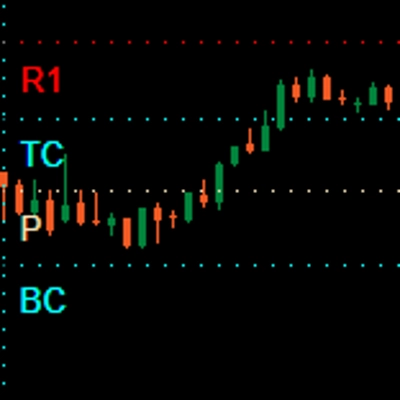
Draws pivots (P, S/R, CPR) from selected anchors like H1–Month1, with optional mid-levels (PS1, S1S2, etc.)
Lightweight Risk-Reward Visualization Tool.
Structure-aware indicator that re-anchors VWAP to confirmed swing pivots.
PRO Liquidity Sweep + FVG Combo detector with custom Gold/Blue signals & alerts
Explore 88 harmonic price-pattern variants with interactive chart controls and geometric reference levels.
Dynamic Swing Anchored VWAP
The levels you mark each morning, drawn and followed: PDH/PDL, weekly, monthly, sessions, equal highs/lows.
Session volume profiles from tick volume: POC, value area high and low, and naked POCs extended until touched.
KILLZONES AND MACRO SESSIONS

Precio

2
Ventas
7.31K
Instalaciones gratis