Descrizione
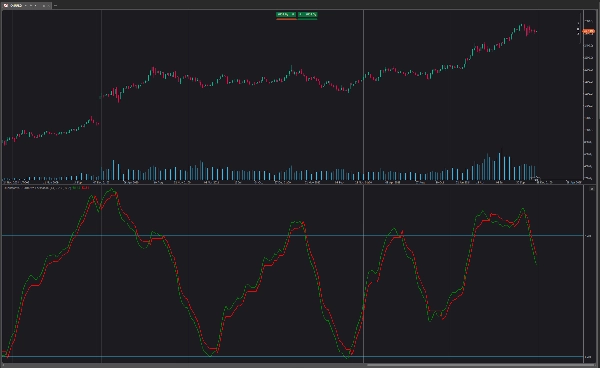
L'oscillatore ponderato QQE (Quantitative Qualitative Estimation) migliora la sua versione originale ponderando il RSI in base alle indicazioni fornite dal trailing stop, richiedendo più sforzo affinché si verifichi un incrocio con il trailing stop. L'oscillatore ponderato QQE è composto da un oscillatore RSI smussato e da un trailing stop derivato dallo stesso RSI.
L'oscillatore può essere utilizzato per indicare se il mercato è ipercomprato/ipervenduto così come per una prima indicazione di inversioni di tendenza grazie alla natura anticipatrice del RSI.
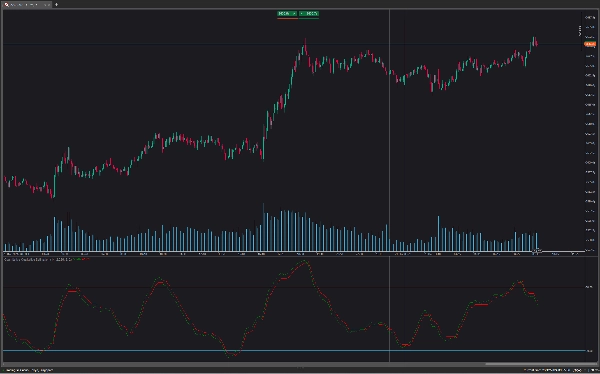
L'uso di valori più alti di Factor restituirà un trailing stop a lungo termine.
Come con un RSI regolare, la divergenza può essere indicativa di un'inversione.
Una ponderazione ulteriore controllerà quanto "sforzo" è richiesto affinché il trailing stop incroci il RSI. Per esempio. Per esempio, un RSI sopra il trailing stop richiederà un grado maggiore di variazioni negative del prezzo affinché si verifichi un potenziale incrocio utilizzando pesi più elevati.
Questo può causare che ponderazioni più alte restituiscano risultati più ciclici e più fluidi.
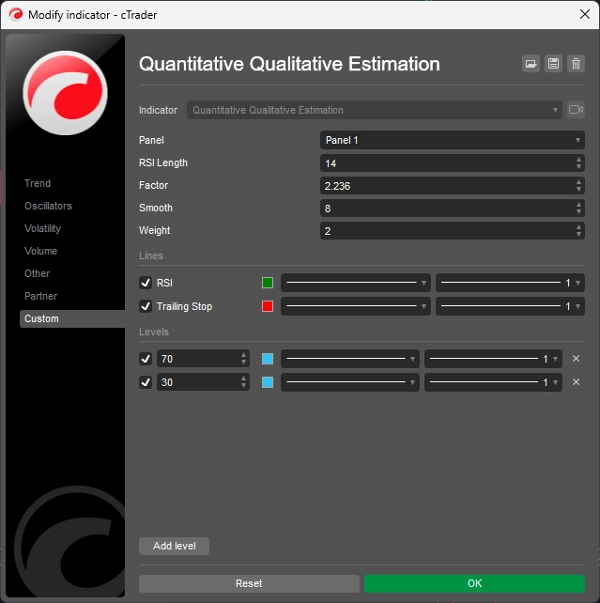
Come modificare le impostazioni:
- Length: Lunghezza dell'oscillatore RSI.
- Factor: Fattore moltiplicativo usato per il calcolo del trailing stop.
- Smooth: Grado di smussatura dell'oscillatore RSI.
- Weight: Grado di ponderazione usato per il calcolo del RSI.
Riepilogo
Recensioni dei clienti
5 | 100 % | |
4 | 0 % | |
3 | 0 % | |
2 | 0 % | |
1 | 0 % |


![Logo di "[Stellar Strategies] Smart ADX"](https://cdn.ctrader.com/image/webp/af13b084-b6f6-41db-b7bc-c7e688b57b05_36929)