
Descripción
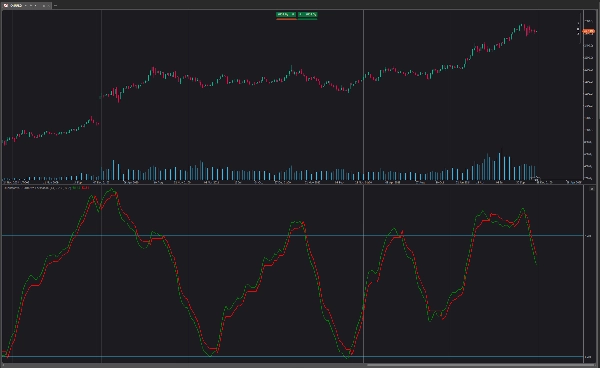
El Oscilador Ponderado QQE (Estimación Cuantitativa Cualitativa) mejora su versión original al ponderar el RSI basado en las indicaciones dadas por el trailing stop, requiriendo más esfuerzo para que ocurra un cruce con el trailing stop. El Oscilador Ponderado QQE está compuesto por un oscilador RSI suavizado y un trailing stop derivado de este mismo RSI.
El oscilador puede usarse para indicar si el mercado está sobrecomprado/sobrevendido así como una indicación temprana de reversión de tendencias gracias a la naturaleza adelantada del RSI.
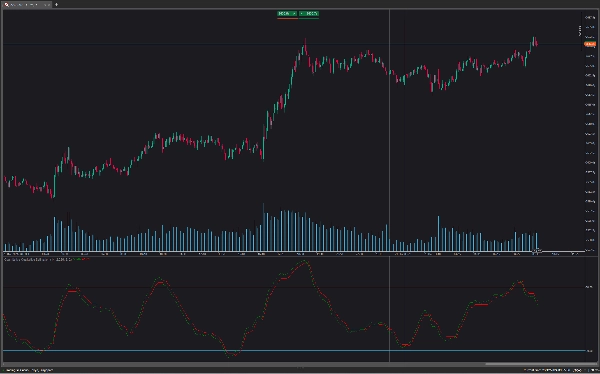
Usar valores más altos de Factor devolverá un trailing stop a más largo plazo.
Al igual que con un RSI regular, la divergencia puede ser indicativa de una reversión.
Una ponderación adicional controlará cuánto "esfuerzo" se requiere para que el trailing stop cruce el RSI. Por ejemplo. Por ejemplo, un RSI por encima del trailing stop requerirá un mayor grado de variaciones negativas en el precio para que ocurra un cruce potencial al usar ponderaciones más altas.
Esto puede causar que ponderaciones más altas devuelvan resultados más cíclicos y suaves.
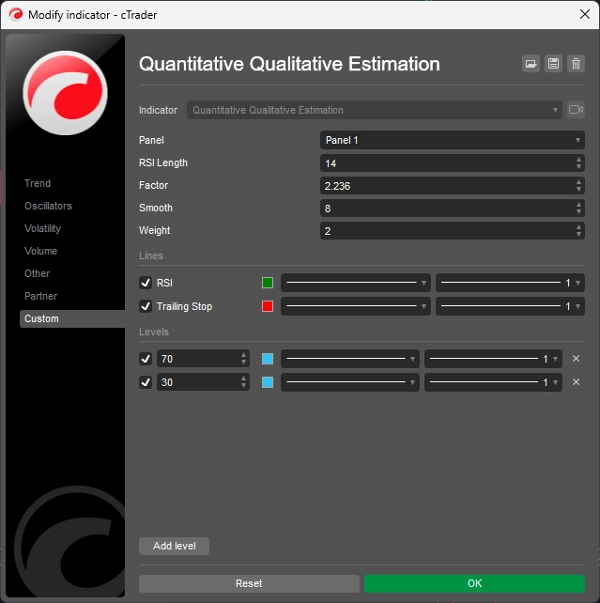
Cómo cambiar la configuración:
- Longitud: Longitud del oscilador RSI.
- Factor: Factor multiplicativo usado para el cálculo del trailing stop.
- Suavizado: Grado de suavidad del oscilador RSI.
- Peso: Grado de ponderación usado para el cálculo del RSI.
Resumen
Valoraciones de clientes
5 | 100 % | |
4 | 0 % | |
3 | 0 % | |
2 | 0 % | |
1 | 0 % |


