
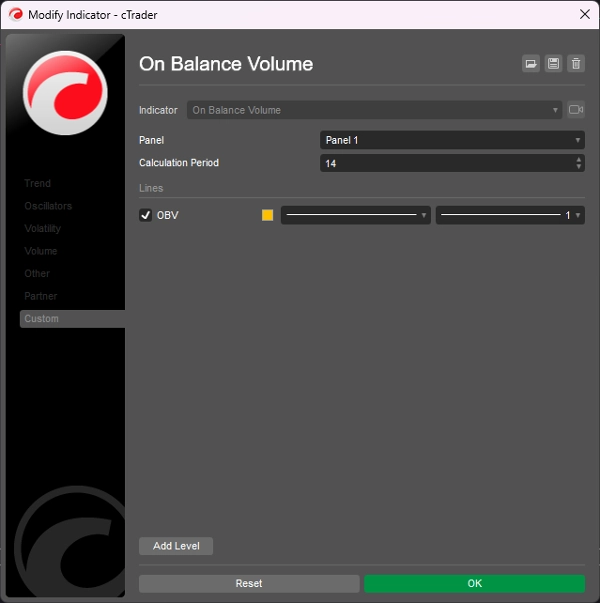
On Balance Volume
Indicador
247 descargas
Versión 1.0, Dec 2024
Windows, Mac
5.0
Valoraciones: 1
Descripción
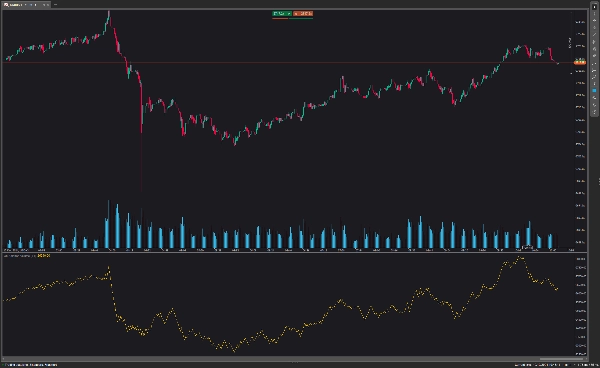
El Volumen en Balance (OBV) mide la presión de compra y venta como un indicador acumulativo que suma el volumen en los días al alza y resta el volumen en los días a la baja.
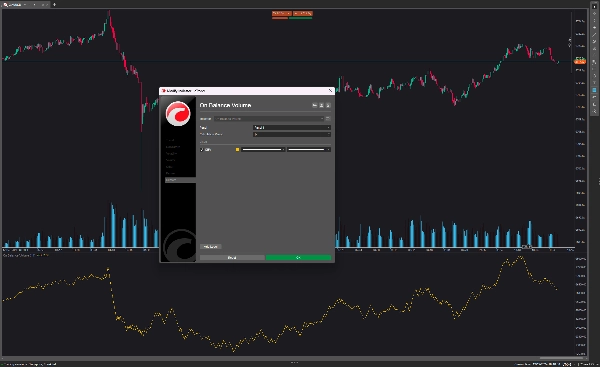
El Volumen en Balance se muestra en la parte inferior del gráfico. La línea OBV sube cuando el precio de cierre de hoy crece y baja cuando el precio de cierre de ayer es más alto que el actual.
El indicador OBV generalmente identifica una ruptura antes que la línea de precio y ayuda a establecer una clara tendencia alcista. Si quieres operar con esta estrategia, abres una posición de forex en el nivel de precio de ruptura y colocas un stop loss por encima del reciente máximo oscilante
Resumen
Resumen de IA
On Balance Volume (OBV) is a technical indicator that measures buying and selling pressure by cumulatively adding volume on days when the closing price rises and subtracting volume on days when it falls. Displayed at the bottom of the chart, the OBV line moves upward when today's closing price exceeds the previous day's and moves downward when it is lower. This indicator is used to identify potential breakouts ahead of price movements and to confirm upward trends. Traders using OBV may open positions at breakout price levels and set stop losses above recent high swings. The indicator is applicable in forex markets and supports breakout trading strategies.
Perfil del indicador
Valoraciones de clientes
5.0
Valoraciones: 1
5 | 100 % | |
4 | 0 % | |
3 | 0 % | |
2 | 0 % | |
1 | 0 % |
Valoraciones de clientes
August 18, 2025
Pros: A lightweight cumulative volume indicator that confirms price moves and detects divergences. Excellent for analyzing trend strength and sentiment. Cons: No alerts, tooltips, or template features. Signals may lag in volatile or manipulated markets.
Conversación
Preguntas frecuentes
Forex
Breakout
Los productos disponibles a través de cTrader Store, incluidos bots, indicadores y plugins para operar, son proporcionados por desarrolladores de terceros y están disponibles únicamente con fines informativos y de acceso técnico. cTrader Store no es un bróker, por lo que no proporciona asesoramiento de inversión, recomendaciones personales ni ninguna garantía de rentabilidad futura.
Más de este autor


![Logotipo de "High-Low Divergence [Iridio Capital]"](https://cdn.ctrader.com/image/webp/443c4661-7abb-40f1-842f-4b6ec560649b_40914)


Precio
2
Ventas
6.9K
Instalaciones gratis