
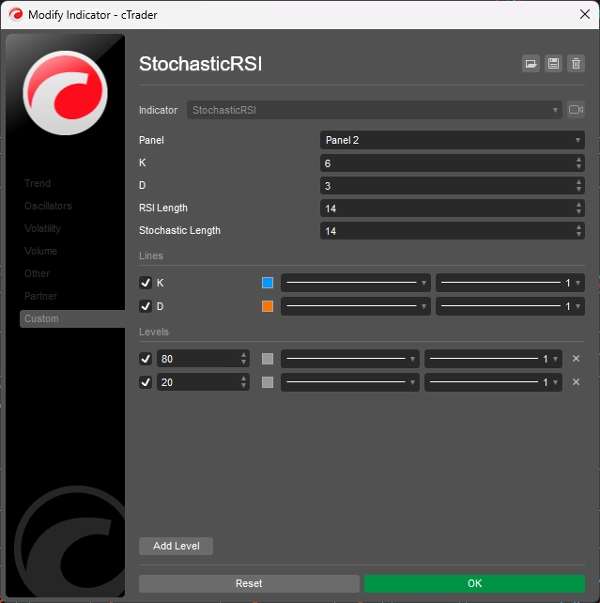
StochasticRSI
Indicador
1.16K descargas
Versión 1.0, Nov 2024
Windows, Mac
5.0
Valoraciones: 1
Descripción
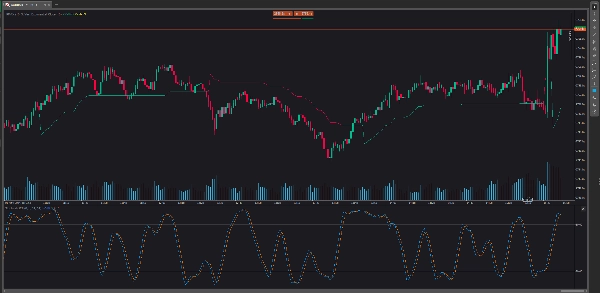
El RSI estocástico (StochRSI) es un indicador de análisis técnico utilizado para apoyar la predicción del mercado de valores comparando el rango de precios de un valor con su precio de cierre. El StochRSI es único porque se centra en el impulso del mercado y es bueno para leer condiciones de mercado sobrecompradas y sobrevendidas. El StochRSI se diferencia de otros indicadores técnicos, como el Índice de Fuerza Relativa (RSI), porque se mueve de precios sobrecomprados a sobrevendidos más rápido que el RSI.
Resumen
Perfil del indicador
Valoraciones de clientes
5.0
Valoraciones: 1
5 | 100 % | |
4 | 0 % | |
3 | 0 % | |
2 | 0 % | |
1 | 0 % |
Valoraciones de clientes
July 9, 2025
Pros: Combines Stochastic Oscillator and RSI for improved overbought/oversold detection. Easy to set up, stable on all timeframes. Cons: No tooltips or alerts. Requires confirmation from trend indicators to avoid false signals. Limited customization options.
Conversación
Preguntas frecuentes
Indices
RSI
Los productos disponibles a través de cTrader Store, incluidos bots, indicadores y plugins para operar, son proporcionados por desarrolladores de terceros y están disponibles únicamente con fines informativos y de acceso técnico. cTrader Store no es un bróker, por lo que no proporciona asesoramiento de inversión, recomendaciones personales ni ninguna garantía de rentabilidad futura.
Más de este autor


Precio
2
Ventas
6.9K
Instalaciones gratis