Beschreibung
Major Tops and Bottoms Indikator: Ein umfassender Überblick
Einführung
In der schnelllebigen Welt des Tradings kann das richtige Werkzeug den entscheidenden Unterschied machen. Der Major Tops and Bottoms Indikator wurde entwickelt, um kritische Wendepunkte im Markt zu identifizieren, sodass Trader fundierte Entscheidungen treffen können. Dieses leistungsstarke Tool nutzt fortschrittliche Algorithmen, um bedeutende Hoch- und Tiefpunkte zu erkennen, wodurch Ihre Handelsstrategie verbessert und Ihre Gesamtleistung gesteigert wird. Mit einer durchschnittlichen Genauigkeitsrate von etwa 60 % bis 70 % im 45-Minuten-Zeitrahmen ist dieser Indikator ein verlässliches Werkzeug für Trader, die von Marktbewegungen profitieren möchten, und eignet sich ideal sowohl für Daytrader als auch Scalper.
Hauptmerkmale
1. Visuelle Darstellung
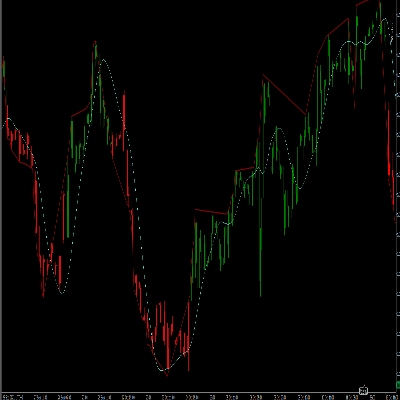
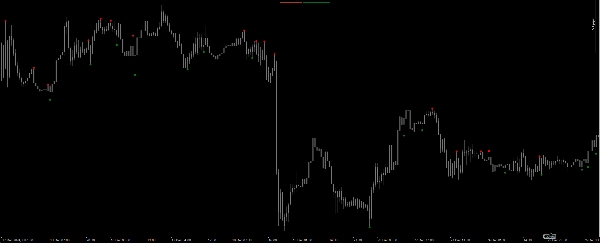
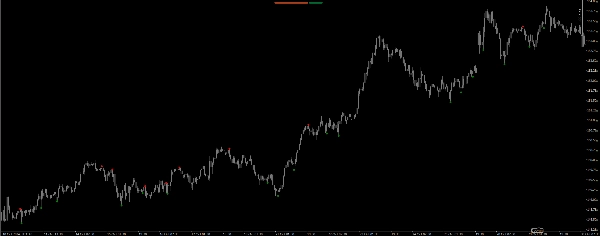
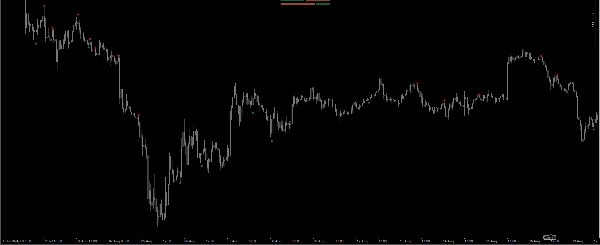
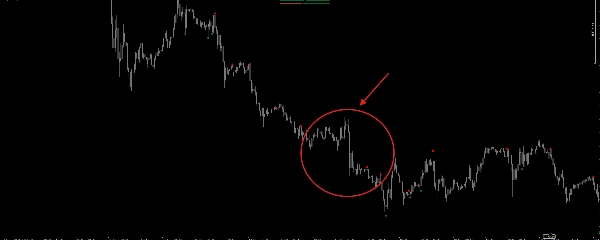
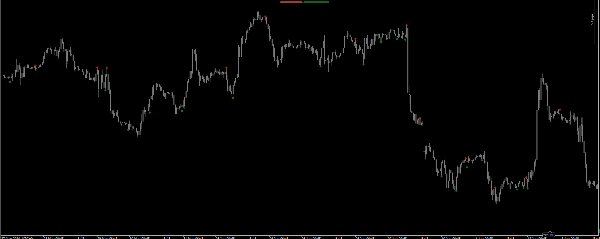
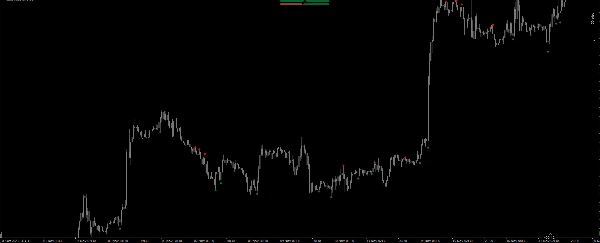
Der Major Tops and Bottoms Indikator bietet eine klare visuelle Darstellung der Marktdynamik. Mit großen Hochpunkten in Rot und großen Tiefpunkten in Grün können Trader potenzielle Wendepunkte schnell erkennen. Die Verwendung von Punkten sorgt dafür, dass diese kritischen Niveaus im Chart hervorstechen, was das Erkennen von Handelsmöglichkeiten auf einen Blick erleichtert.
2. Präzise Berechnungen
Der Kern des Major Tops and Bottoms Indikators liegt in seiner Berechnungsmethode. Durch die Analyse der Kursbewegungen der letzten vier Balken bestimmt der Indikator, ob ein großer Hoch- oder Tiefpunkt gebildet wurde. Dies wird durch eine Reihe von Vergleichen der Hoch- und Tiefpreise erreicht, wodurch sichergestellt wird, dass nur bedeutende Wendepunkte identifiziert werden.
3. Verbesserte Scalping-Techniken
Für Trader, die sich auf Scalping spezialisieren, ist der Major Tops and Bottoms Indikator ein unschätzbares Werkzeug. Durch die Identifikation wichtiger Wendepunkte können Trader Positionen präzise eröffnen und schließen. Die Fähigkeit, große Hoch- und Tiefpunkte schnell zu erkennen, ermöglicht enge Take-Profit- (TP) und Stop-Loss- (SL) Platzierungen, wodurch das Risiko minimiert und die potenziellen Gewinne maximiert werden. Aufgrund seiner Genauigkeit von etwa 60 % bis 70 % im 45-Minuten-Zeitrahmen wird dringend empfohlen, Stop-Losses zu verwenden, um potenzielle Verluste zu begrenzen, falls ein Signal verpasst wird.
Vorteile der Verwendung des Major Tops and Bottoms Indikators
1. Verbesserte Entscheidungsfindung
Der Major Tops and Bottoms Indikator befähigt Trader, fundierte Entscheidungen auf Basis einer genauen Marktanalyse zu treffen. Durch die Identifikation signifikanter Hoch- und Tiefpunkte können Trader Kursbewegungen besser antizipieren und ihre Strategien entsprechend anpassen. Dieser verbesserte Entscheidungsprozess steigert die Gesamtleistung im Trading.
2. Erhöhtes Gewinnpotenzial
Mit der Fähigkeit, kritische Wendepunkte genau zu bestimmen, können Trader Marktumkehrungen effektiver nutzen. Der Major Tops and Bottoms Indikator ermöglicht es Tradern, Positionen zu optimalen Zeitpunkten einzugehen, was ihr Gewinnpotenzial erhöht. Durch die Nutzung enger TP- und SL-Niveaus können Trader ihre Gewinne maximieren und gleichzeitig ihr Risiko minimieren.
3. Benutzerfreundliche Oberfläche
Der Major Tops and Bottoms Indikator wurde mit Blick auf die Benutzerfreundlichkeit entwickelt. Die klare visuelle Darstellung der großen Hoch- und Tiefpunkte stellt sicher, dass Trader die vom Indikator gelieferten Signale leicht interpretieren können. Diese benutzerfreundliche Oberfläche macht ihn für Trader aller Erfahrungsstufen zugänglich.
4. Vielseitige Anwendung
Egal, ob Sie Daytrader, Swingtrader oder Scalper sind, der Major Tops and Bottoms Indikator kann in verschiedenen Handelsstrategien eingesetzt werden. Seine Vielseitigkeit macht ihn zu einer wertvollen Ergänzung im Werkzeugkasten eines jeden Traders und ermöglicht eine größere Flexibilität bei der Anpassung an unterschiedliche Marktbedingungen.
Fazit
Zusammenfassend ist der Major Tops and Bottoms Indikator ein leistungsstarkes Werkzeug, das Handelsstrategien durch die Identifikation kritischer Marktwendepunkte verbessert. Mit seinen präzisen Berechnungen, der visuellen Darstellung und der Kompatibilität mit der cTrader-Plattform befähigt dieser Indikator Trader, fundierte Entscheidungen zu treffen und von Marktbewegungen zu profitieren. Bei einer Genauigkeitsrate von etwa 70 % ist es entscheidend, Stop-Losses einzusetzen, um Verluste zu minimieren, wenn ein Signal verpasst wird. Für optimale Ergebnisse wird empfohlen, diesen Indikator im 45-Minuten-Zeitrahmen zu verwenden. Egal, ob Sie ein erfahrener Trader sind oder gerade erst anfangen, der Major Tops and Bottoms Indikator kann Ihre Handelsleistung erheblich verbessern. Verbessern Sie noch heute Ihr Trading-Erlebnis, indem Sie dieses innovative Tool in Ihre Strategie integrieren.
Zusammenfassung
Kundenbewertungen
5 | 50 % | |
4 | 50 % | |
3 | 0 % | |
2 | 0 % | |
1 | 0 % |