
Description
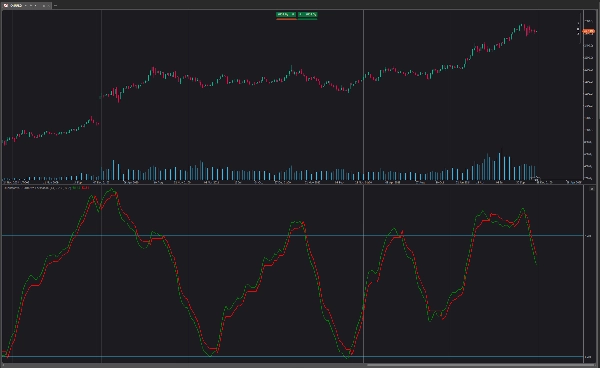
L'oscillateur pondéré QQE (Quantitative Qualitative Estimation) améliore sa version originale en pondérant le RSI en fonction des indications données par le trailing stop, nécessitant plus d'efforts pour qu'un croisement avec le trailing stop se produise. L'oscillateur pondéré QQE est composé d'un oscillateur RSI lissé et d'un trailing stop dérivé de ce même RSI.
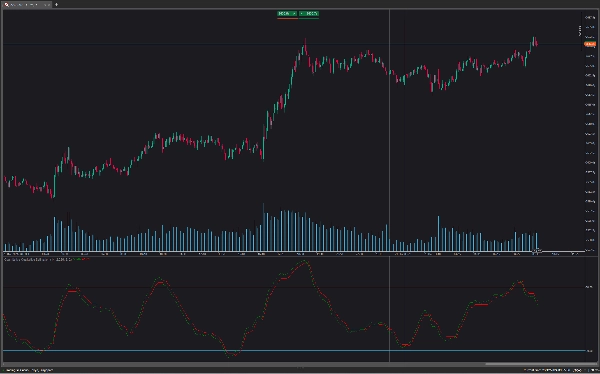
L'oscillateur peut être utilisé pour indiquer si le marché est suracheté/survendu ainsi que comme indication précoce des retournements de tendance grâce à la nature anticipatrice du RSI.
L'utilisation de valeurs de Factor plus élevées donnera un trailing stop à plus long terme.
Comme avec un RSI classique, une divergence peut indiquer un retournement.
Une pondération supplémentaire contrôlera la quantité "d'effort" requise pour que le trailing stop croise le RSI. Par exemple, un RSI au-dessus du trailing stop nécessitera un degré plus élevé de variations négatives des prix pour qu'un croisement potentiel se produise lors de l'utilisation de poids plus élevés.
Cela peut amener des pondérations plus élevées à produire des résultats plus cycliques et plus lisses.
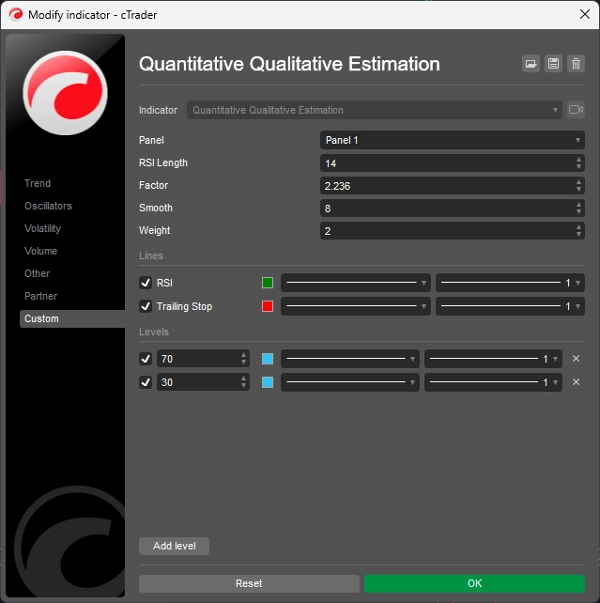
Comment modifier les paramètres :
- Length : Longueur de l'oscillateur RSI.
- Factor : Facteur multiplicatif utilisé pour le calcul du trailing stop.
- Smooth : Degré de lissage de l'oscillateur RSI.
- Weight : Degré de pondération utilisé pour le calcul du RSI.
Résumé
Avis clients
5 | 100 % | |
4 | 0 % | |
3 | 0 % | |
2 | 0 % | |
1 | 0 % |


