
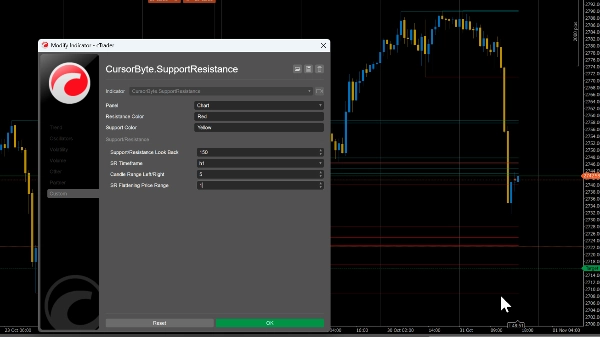
CursorByte.SupportResistance v3
지표
292 다운로드
버전 1.0, Mar 2025
Windows, Mac
5.0
리뷰: 1
설명
***개선된 버전***
https://ctrader.com/products/2113
***********************
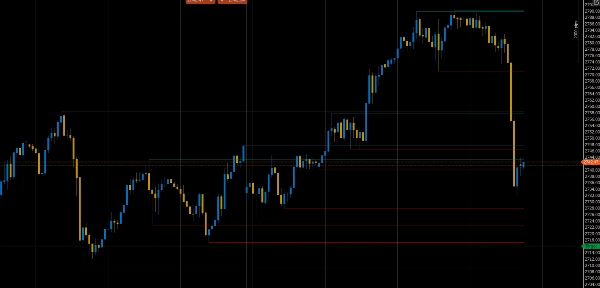
페어에 따라 평탄화 가격 범위를 설정할 수 있습니다. GU와 같은 페어에는 0.0001, 금에는 1.5를 사용하세요.
이 지표는 차트에서 주요 지지 및 저항 수준을 자동으로 식별하여, 트레이더가 잠재적인 반전 구역, 돌파 지점 및 가격 통합 구역을 파악하여 더 나은 진입 및 청산 결정을 내릴 수 있도록 도와줍니다.
참고: 평탄화 가격 범위를 사용하여 차트의 혼잡을 줄이세요 (특정 가격 범위 내의 SR 라인을 하나로 통합).
요약
지표 프로필
고객 리뷰
5.0
리뷰: 1
5 | 100 % | |
4 | 0 % | |
3 | 0 % | |
2 | 0 % | |
1 | 0 % |
고객 리뷰
August 12, 2025
Pros: Accurate auto SR levels, customizable design, stable performance. Cons: No significance filter, no auto-clear, possible chart clutter.
상담
자주 묻는 질문(FAQ)
Breakout
Commodities
XAUUSD
트레이딩 봇, 지표, 플러그인 등 cTrader Store에서 제공되는 상품은 제3자 개발자에 의해 제공되며, 이는 단순히 정보 및 기술적 접근을 목적으로 제공된 것입니다. cTrader Store는 중개인이 아니며, 투자 조언, 개인별 추천 또는 향후 성과에 대한 어떠한 보장도 제공하지 않습니다.


가격
가입일 31/10/2024
56
판매
1.75K
무료 설치