
📊 일일 핍 범위 대시보드 (세션 정렬 ADR 도구)
The 일일 핍 범위 대시보드는 차트에 실시간 일일 범위 통계를 직접 표시하는 전문 거래 유틸리티로, 브로커의 UTC 세션에 완벽하게 정렬되어 있습니다.
정밀 거래자를 위해 설계된 이 도구는 실제 세션 기반 일일 경계를 사용하여 고가-저가 핍 범위를 계산하고 시장 상황 및 변동성 분석을 위한 강력한 롤링 통계를 제공합니다.
🔥 주요 기능
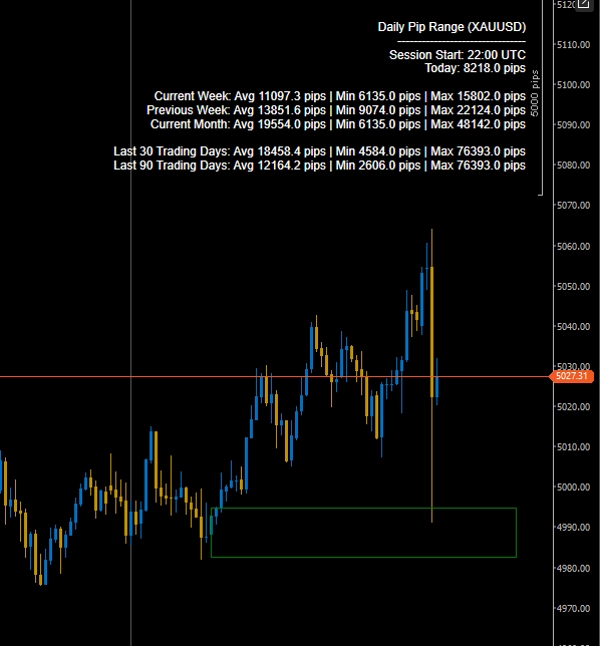
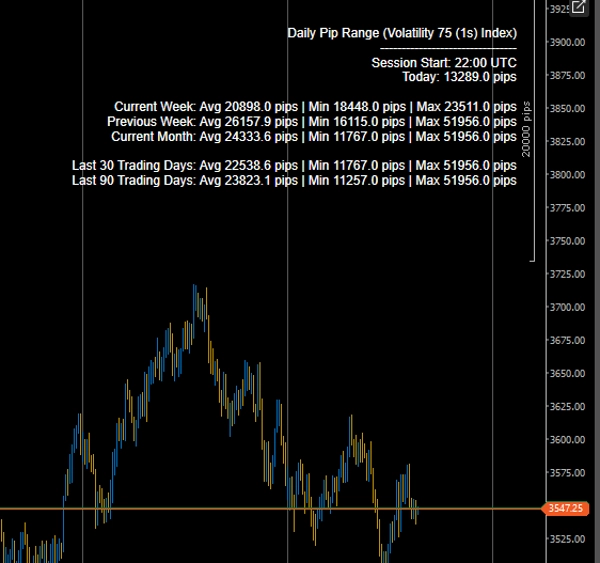
✅ 오늘의 실시간 일일 범위 (핍 단위 고가-저가)
현재 세션의 핍 범위가 실시간으로 업데이트되는 것을 확인하세요.
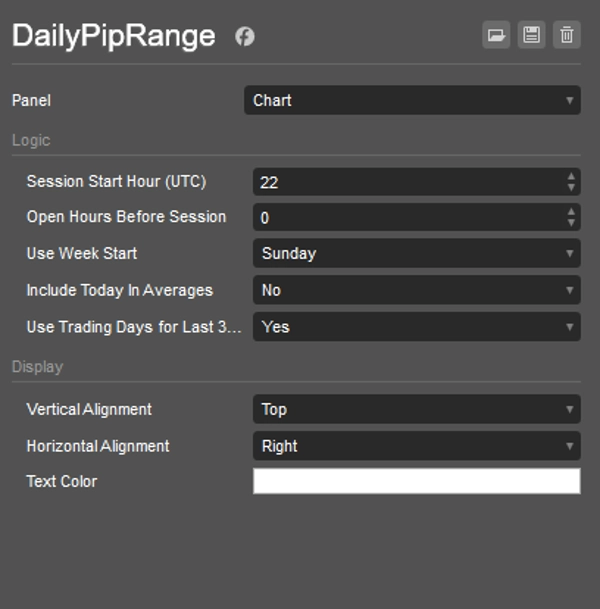
✅ 세션 정렬 계산 (UTC 제어)
다음 정의:
- 세션 시작 시간 (UTC)
- 세션 전 오픈 시간
이것은 일일 통계가 브로커의 거래일과 일치하도록 보장하며, NY 마감 정렬 및 기관 스타일 분석에 이상적입니다.
✅ 고급 통계 분해
각 기간에 대해 지표는 다음을 표시합니다:
- 평균 일일 범위
- 최소 일일 범위
- 최대 일일 범위
포함된 기간:
- 현재 주
- 이전 주
- 현재 월
- 지난 30일
- 지난 90일
✅ 거래일 또는 달력일 전환
다음 중 선택하세요:
- 지난 30/90 달력일
- 지난 30/90 거래일 (일간 바만 해당)
주말과 비거래 공백을 필터링하는 데 완벽합니다.
✅ 사용자 지정 가능한 표시
- 조정 가능한 화면 위치 (오른쪽 상단 등)
- 텍스트 색상 사용자 지정
- 가볍고 방해되지 않는 오버레이
🎯 이 도구를 사용하는 이유?
- 변동성 확장 및 축소 식별
- 오늘의 범위를 과거 평균과 비교
- 돌파 전 압축 감지
- ADR 컨텍스트 기반 거래 필터링
- 변동성 조건에 따른 위험 크기 개선
당일 거래, 스윙 거래 또는 금 거래를 하든 이 도구는 복잡함 없이 즉각적인 변동성 정보를 제공합니다.
⚙️ 이상적인 대상
- 외환 거래자
- 금 (XAUUSD) 거래자
- 지수 거래자
- 변동성 기반 시스템
- 돌파 거래자
- 기관 스타일 범위 분석
🚀 전문 변동성 인식 - 차트에서 직접
성능, 정확성 및 세션 정밀도를 위해 제작되었습니다.
지표 프로필
4.5
리뷰: 2
5 | 50 % | |
4 | 50 % | |
3 | 0 % | |
2 | 0 % | |
1 | 0 % |
Signal
Indices
Commodities
GBPUSD
RSI
Bollinger
Fibonacci
Scalping
AI
XAUUSD
NAS100
MACD
BTCUSD
Forex
Breakout
EURUSD
NZDUSD
Martingale
Prop
ZigZag
Supertrend
Fair Value Gap
SMC
Crypto
Grid
Stocks
ATR
USDJPY
VWAP
트레이딩 봇, 지표, 플러그인 등 cTrader Store에서 제공되는 상품은 제3자 개발자에 의해 제공되며, 이는 단순히 정보 및 기술적 접근을 목적으로 제공된 것입니다. cTrader Store는 중개인이 아니며, 투자 조언, 개인별 추천 또는 향후 성과에 대한 어떠한 보장도 제공하지 않습니다.


!["[Stellar Strategies] Market Session Ultimate" 로고](https://cdn.ctrader.com/image/webp/61ffd537-0125-4246-9e72-42eca1791d64_28232)


가입일 31/10/2024
55
판매
1.73K
무료 설치