

설명
TradingViewMACD 지표
cAlgo 플랫폼을 위해 설계된 고도로 사용자 정의 가능한 TradingViewMACD 지표로 거래 전략을 향상시키세요. 이 강력한 도구는 시장 분석을 최적화하는 데 필요한 유연성과 정밀성을 결합합니다.
주요 특징:
- 사용자 정의 가능한 매개변수:
-
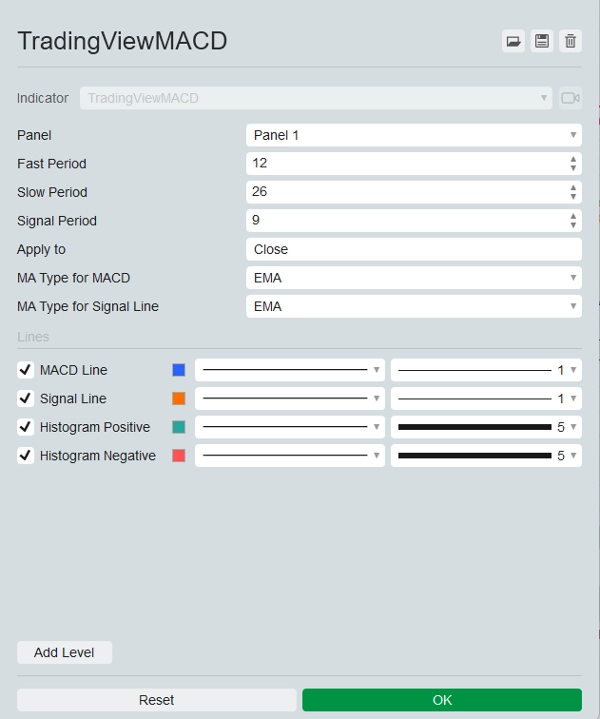
- 빠른 기간: 거래 스타일에 맞게 빠른 이동 평균 기간을 조정하세요.
- 느린 기간: 신호 정확도를 높이기 위해 느린 이동 평균 기간을 설정하세요.
- 신호 기간: 진입 및 퇴출 시점을 미세 조정하기 위해 신호선 기간을 설정하세요.
- 적용 가격: 지표를 적용할 가격으로 시가, 고가, 저가, 종가, 중간값, 전형값 또는 가중 가격 중에서 선택하세요.
- 다양한 이동 평균 유형:
-
- MACD선과 신호선 모두에 대해 단순 이동 평균(SMA)과 지수 이동 평균(EMA) 중에서 선택하여 분석의 유연성을 제공합니다.
- 시각적 출력:
-
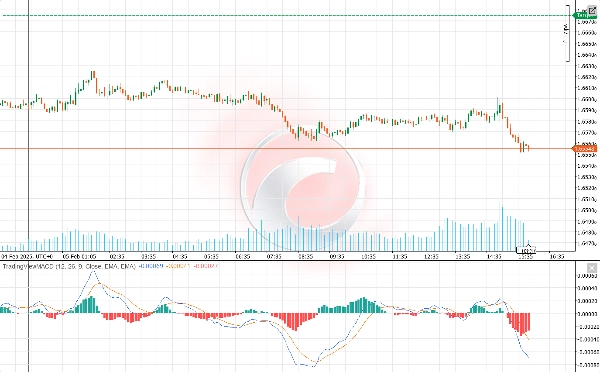
- MACD선: 명확한 가시성을 위해 선명한 파란색으로 표시됩니다.
- 신호선: MACD선과 쉽게 구분할 수 있도록 생생한 주황색으로 강조 표시됩니다.
- 히스토그램: 시장 모멘텀을 명확하게 시각화하기 위해 양수와 음수를 각각 초록색과 빨간색으로 구분하여 표시합니다.
- 향상된 시장 통찰력:
-
- 지표는 빠른 이동 평균과 느린 이동 평균 간의 차이를 계산하여 MACD선을 생성합니다.
- MACD선의 이동 평균으로 신호선을 계산합니다.
- 히스토그램은 MACD선과 신호선 간의 차이를 시각적으로 나타내어 잠재적인 매수 및 매도 신호를 식별하는 데 도움을 줍니다.
- 사용자 친화적:
-
- 설치 및 구성이 쉬워 모든 수준의 트레이더가 고급 기능을 활용할 수 있습니다.
- 원활한 경험을 보장하는 포괄적인 문서와 고객 지원을 제공합니다.
TradingViewMACD 지표로 거래 전략의 잠재력을 최대한 발휘하세요. 시장 분석을 강화하고, 정보에 입각한 결정을 내리며, 이 필수 거래 도구로 앞서 나가십시오.
요약
지표 프로필
고객 리뷰
5.0
리뷰: 1
5 | 100 % | |
4 | 0 % | |
3 | 0 % | |
2 | 0 % | |
1 | 0 % |
고객 리뷰
November 9, 2025
TradingView MACD brings the familiar feel straight to cTrader 🚀 - smooth, light, and 100% accurate to the original. Perfect for traders switching from TV who love clean momentum signals. Missing alerts, but flawless for classic trend and divergence play.
상담
자주 묻는 질문(FAQ)
Signal
MACD
트레이딩 봇, 지표, 플러그인 등 cTrader Store에서 제공되는 상품은 제3자 개발자에 의해 제공되며, 이는 단순히 정보 및 기술적 접근을 목적으로 제공된 것입니다. cTrader Store는 중개인이 아니며, 투자 조언, 개인별 추천 또는 향후 성과에 대한 어떠한 보장도 제공하지 않습니다.


가격
가입일 22/11/2024
133
판매
2.57K
무료 설치