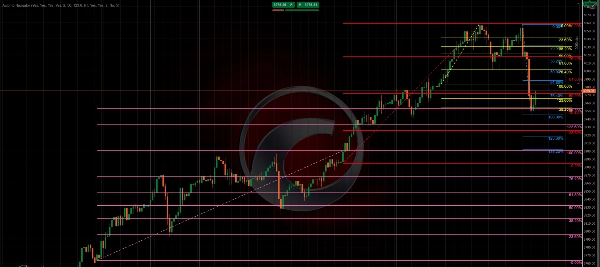
중개인 및 프랍
비즈니스용
00
Days
:
00
Hours
:
00
Minutes
:
00
Seconds
지표
NAS100
NZDUSD
XAUUSD
Commodities
Forex
EURUSD
GBPUSD
BTCUSD
Indices
Prop
Stocks
Crypto
USDJPY
AutoFib Navigator
13/11/2025
Desktop
가입일 31/10/2024
판매
20
무료 설치
1428
"AutoFib Navigator" 업로드된 이미지

AutoFib Navigator automatically draws Fibonacci retracements for the Daily, Yesterday, Current Week, and Previous Week sessions.
It provides a clear and consistent view of market retracements, extensions, and session-based swing behavior without manual plotting.

The tool intelligently adapts to price action — updating only when price moves beyond a configurable Target Trigger (e.g., 123.6%) — ensuring your chart remains accurate and uncluttered throughout the trading day or week.


Key Features

  • Automatic Fibonacci Zones: Draws Daily, Yesterday, Weekly, and Previous Week retracements in real time.
  • Smart Redraw Logic: Recalculates only after price breaks the defined target extension, avoiding unnecessary re-anchoring.
  • Directional Awareness: Automatically flips Fibonacci orientation based on price relative to the 50% retracement level.
  • Customizable Parameters: Colors, visibility, timeframe, line thickness, and redraw behavior can all be adjusted.
  • Optimized Performance: Lightweight background process using a timed update system for efficiency.
  • Professional Presentation: Clean and consistent chart visuals suitable for all trading styles.


Recommended Use

Use AutoFib Navigator to identify dynamic retracement and expansion levels across daily and weekly sessions.
It is ideal for traders who rely on Fibonacci confluence, structure analysis, or multi-session setups.

0.0
리뷰: 0
고객 리뷰
이 상품에 대한 리뷰가 아직 없습니다. 이미 사용해 보셨나요? 다른 사람들에게 가장 먼저 소개해 주세요!
이 작성자의 상품 더 보기
지표
NAS100
NZDUSD
Breakout
+13
SupportResistance
Auto-detect support and resistance & trendlines, highlight pullbacks/BOS retests, and filter with candle confirmation.
cBot
Prop
Commodities
Forex
+1
Risk Manager v1_1
Daily profit/loss risk manager with lock feature—auto-stops trading once limits are hit.
데스크톱 플러그인
NAS100
NZDUSD
XAUUSD
+10
PnL Calendar
Visual calendar with daily PnL, trades, win rate, profit factor, and performance insights.
지표
NAS100
NZDUSD
XAUUSD
+11
Volume Profile Pro
Visualize trading volume by price within any range, highlight POC and key value areas.
지표
NAS100
NZDUSD
XAUUSD
+16
Market Structure Pro
Auto-detect support and resistance & trendlines, highlight pullbacks/BOS retests, and filter with candle confirmation.
좋아하실 만한 다른 항목
VolumeColorBar
Color Volume Bars – Visualize Market Strength Instantly
[Hamster-Coder] Moving Average
Universal Moving Average indicator with extended features
지표
NAS100
NZDUSD
Breakout
+11
Consolidation Zones
Identify and trade breakouts with Consolidation Zones! Visualize price consolidation areas for trading opportunities.
Block Order Rreversal
Order BlockIndicator reversal
지표
VWAP
VWAP (Volume Weighted Average Price)
Customizable VWAP with flexible reset, three band methods, and full Fibonacci level control.
지표
NAS100
Indices
XAUUSD
+6
JacksonZones
Maps intraday and multiday structure using Fibonacci-projected session ranges.
Tiny_Aim_Trainer
trading stress-relief “mini-game”
지표
RSI
Forex
Signal
+2
Rsi_custom
🔹 Advanced RSI with smart alerts and visual signals for faster trend reversal detection.
지표
Breakout
ORB v1.1
Opening Range Breakout v1.1 - Visuals + Stats
HTFOverlayPlus
HTFOverlayPlus
FREEE Tradingview Economic Calendar on Chart
Customizable window inside your platform, access to any website Calendar Was Free for early users now -50%
지표
NAS100
NZDUSD
XAUUSD
+7
Bayesian Price Projection Model
Bayesian theory** to forecast a future price while providing **uncertainty ranges** that represent upper and lower bound
지표
NAS100
NZDUSD
Breakout
+12
rolling stdv
Multi-Timeframe Rolling Volatility Indicator - Smart Volatility Breakout System
지표
Bollinger
JMA
Jurik Moving Average (Jurik's Moving Average) triple adaptive filter with unique Jurik smoothing and dynamic factor.
지표
Indices
Breakout
Forex
+2
Time zone pro
FREE Global Trading Sessions Indicator
지표
Breakout
Bollinger
Pressure Scanner
Pressure Scanner is a volatility-and-momentum to show both pressure states (squeeze on/off) and directional
최고 평점
무료
IR Candle MTF
with this indicator you could see other time frame candle in your chart.
지표
RSI
Breakout
Supertrend
+3
Fibonacci Linear Regression Multi-timeframe
Combining Fibonacci levels and regression to analyze multidimensional market trends across multiple timeframes¡