
说明
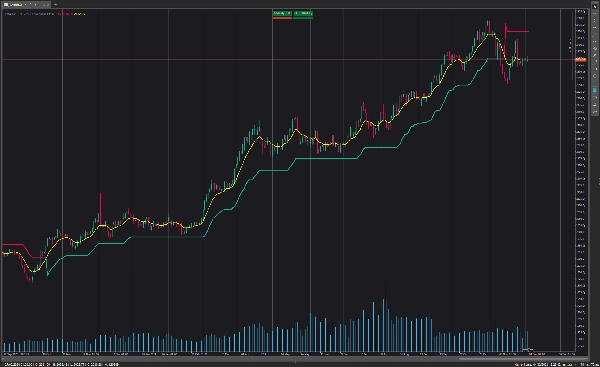
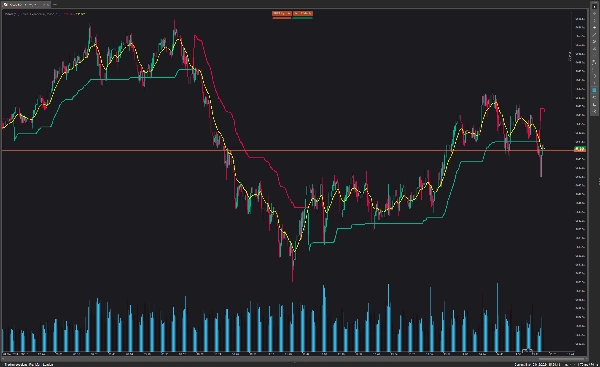
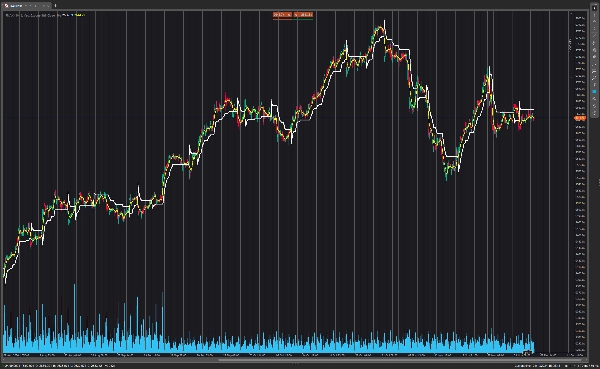
PMax(利润最大化器)是KivancOzbilgic于2020年初开发的全新指标。
它是两个移动止损指标的结合;
一个是Anıl Özekşi的MOST(移动止损)指标,另一个是著名的基于ATR的SuperTrend。
MOST和SuperTrend指标都非常适合趋势跟踪系统,但与大多数其他指标一样,在横盘市场条件下表现不佳。
利润最大化器 - PMax试图解决这个问题。 PMax将MOST(移动平均趋势变换器)和SuperTrend(ATR价格检测)的强大优势结合在一个指标中。
与其前身MOST和SuperTrend相比,PMax的回测和优化结果要好得多。它减少了横盘时的错误信号数量,提供了更可靠的交易信号。
PMax易于判断趋势,可用于任何类型的市场和工具。它不会重绘。
摘要
AI 摘要
PMax (Profit Maximizer) is a technical indicator developed in 2020 that combines two trailing stop loss indicators: Anıl Özekşi's MOST (Moving Stop Loss) and the ATR-based SuperTrend. Both MOST and SuperTrend are effective for trend-following strategies but tend to generate false signals in sideways markets. PMax addresses this limitation by integrating the strengths of MOST’s moving average trend detection and SuperTrend’s ATR price volatility measurement into a single indicator.
This combination enhances trend identification and reduces false signals during non-trending market phases. Backtesting and optimization show that PMax outperforms its component indicators in reliability and signal accuracy. It is designed for use across various markets and instruments and does not repaint, providing consistent signals for traders.
This combination enhances trend identification and reduces false signals during non-trending market phases. Backtesting and optimization show that PMax outperforms its component indicators in reliability and signal accuracy. It is designed for use across various markets and instruments and does not repaint, providing consistent signals for traders.
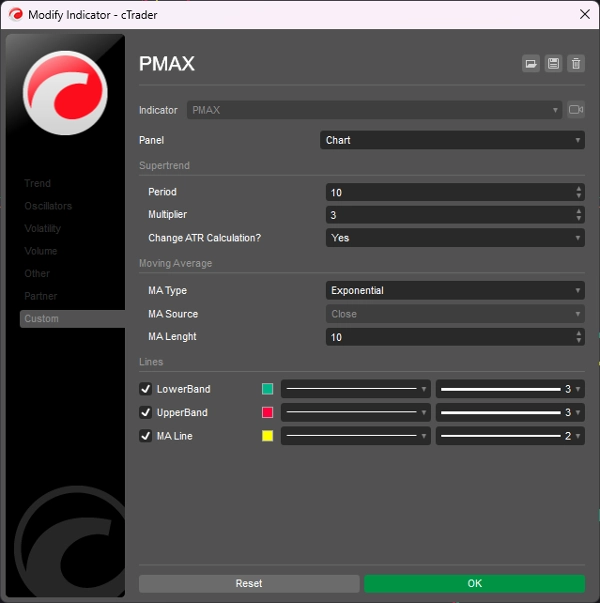
指标配置
客户评价
5.0
评价:6
5 | 100 % | |
4 | 0 % | |
3 | 0 % | |
2 | 0 % | |
1 | 0 % |
客户评价
August 12, 2025
Fantastic Job at translating. Could you tell us how you did the ATR normalization in ctrader, I can't figure it out and I want to built an cbot with this opttion ty!
July 9, 2025
Pros: Combines Moving Average and ATR for dynamic trend detection. Provides clear buy/sell signals. Easy setup, stable performance. Cons: No alerts on signal change. No tooltips or saved templates. Requires additional confirmation for reliable entries.
June 16, 2025
讨论
常见问答
Supertrend
ATR
cTrader Store 提供的所有产品,包括交易机器人、指标和插件,均由第三方开发者提供,仅供信息参考和技术访问之用。cTrader Store 并非经纪商,不提供投资建议、个人推荐或任何未来业绩保证。


价格
2
销售
6.89K
免费安装