
说明
成交量剖面TPO气泡 — 由The Quant制作
成交量剖面TPO气泡是由The Quant创建的高级cTrader指标。
想加入我们吗?链接在简介中
━━━━━━━━━━━━━━━━━━━━━━
成交量剖面TPO气泡
━━━━━━━━━━━━━━━━━━━━━━
成交量剖面TPO气泡 是一个完整的市场解读指标,适用于 cTrader。
它将强大的市场解读工具整合在一个简洁的指标中:
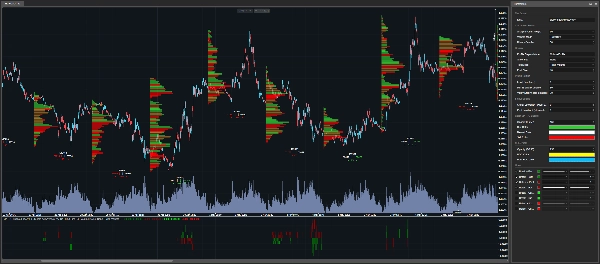
◆ 成交量剖面
◆ 气泡图
◆ TPO
◆ 适用于机器人使用的POC突破与回测信号
此工具专为希望更清晰地读取成交量区域、识别重要POC水平,并在手动或自动策略中使用这些水平的交易者设计。
它为cTrader构建,兼顾视觉分析和cBot自动化。
━━━━━━━━━━━━━━━━━━━━━━
此指标的功能
━━━━━━━━━━━━━━━━━━━━━━
市场活动区域
成交量剖面TPO气泡帮助您识别市场活跃的区域。
这些区域称为POC,或称为控制点。
POC是活动集中的价格区域。
当价格回到该区域时,可能会突破、回测、拒绝或反应。
主要目标
目标不是预测市场。
目标是让重要的市场区域更易于观察、更易于理解,并且更易于在策略中使用。
━━━━━━━━━━━━━━━━━━━━━━
主要视觉模式
━━━━━━━━━━━━━━━━━━━━━━
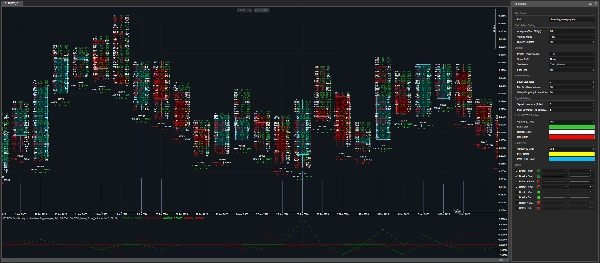
◆ 成交量剖面
成交量剖面模式直接在cTrader图表上显示水平成交量条。
条形越大,表示所选分析蜡烛期间该价格区域越重要。
当您想查看成交量分布的完整结构时,此模式非常有用。
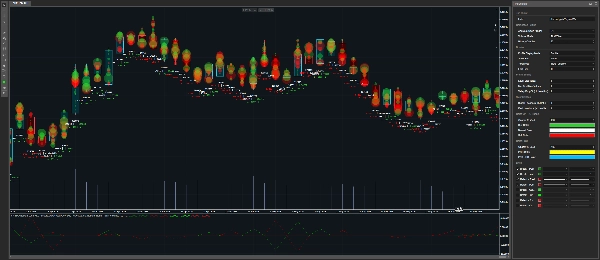
◆ 气泡图
气泡图模式将重要的成交量区域显示为气泡。
气泡越大,表示检测到的区域越重要。
此模式适合快速视觉读取。
它帮助您快速发现图表上最重要的区域。
如果您主要想将指标用作气泡图,可以将显示POC设置为无,然后调整:
• 最大成交量的最小百分比
• 谷值下降百分比
这些设置控制您想看到多少气泡。
较低的值显示更多气泡。
较高的值仅保留最干净的区域。
◆ TPO
TPO模式提供了蜡烛内部发生情况的更详细视图。
它显示:
• 买入成交量
• 卖出成交量
• 差额
• 价格水平活动
当您想了解区域的内部结构而不仅仅是看到成交量位置时,此模式非常有用。
━━━━━━━━━━━━━━━━━━━━━━
TICK与TICKXSIZE逻辑
━━━━━━━━━━━━━━━━━━━━━━
差价合约成交量背景
在差价合约(CFDs)中,交易者不会像期货市场那样获得集中交易所的成交量数据。
成交量基于经纪商的tick数据。
此指标为您提供两种成交量计算模式:
• Tick
• TickXSize
◆ Tick
每个tick计为一个单位。
这是对经纪商tick流的简单读取。
◆ TickXSize
tick根据价格变动的大小加权。
价格变动为1点的tick权重高于价格变动为0.1点的tick。
这有助于揭示那些即使单纯tick计数不明显但运动影响更大的区域。
简单区别
Tick计数事件。
TickXSize计数带有运动权重的事件。
━━━━━━━━━━━━━━━━━━━━━━
POC检测
━━━━━━━━━━━━━━━━━━━━━━
POC的检测方式
指标通过成交量峰值和过滤逻辑检测POC区域。
一个区域必须足够强大且足够孤立,才能被视为相关。
这有助于避免在图表上显示每个小的噪声区域。
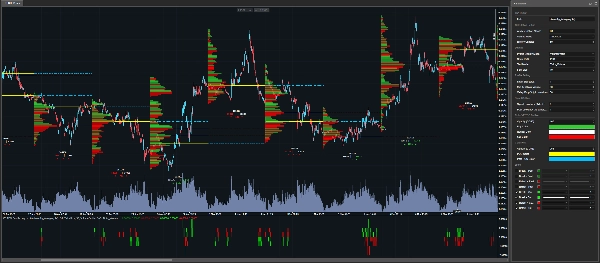
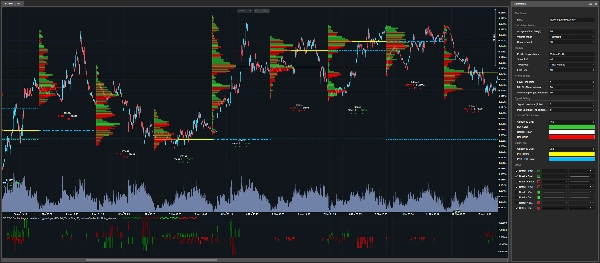
当前和过去的POC
当前POC可以直接显示在图表上。
它们也可以用虚线延伸到下一个分析蜡烛。
过去的POC也可以显示,允许交易者跟踪仍可能重要的旧水平。
━━━━━━━━━━━━━━━━━━━━━━
机器人就绪的突破与回测信号
━━━━━━━━━━━━━━━━━━━━━━
视觉指标与自动化工具
成交量剖面TPO气泡不仅是一个视觉指标。
它还提供了输出序列,可用于cBot或交易机器人中。
检测的信号类型
指标可以检测:
• 当前POC水平的突破
• 当前POC水平的回测
• 过去POC水平的突破
• 过去POC水平的回测
这允许机器人检测价格何时与重要的成交量区域交互。
━━━━━━━━━━━━━━━━━━━━━━
信号评分
━━━━━━━━━━━━━━━━━━━━━━
评分含义
指标不仅返回信号。
它还返回一个评分。
评分告诉机器人哪个POC区域被触及、突破或回测。
评分逻辑
排名基于所选分析蜡烛的开盘价。
正分数代表开盘价之上的POC区域。
负分数代表开盘价之下的POC区域。
示例
• +1 = 开盘价之上的第一个POC区域
• -1 = 开盘价之下的第一个POC区域
• +2 = 开盘价之上的第二个POC区域
• -3 = 开盘价之下的第三个POC区域
数字离零越远,区域距离开盘价越远。
为何这对自动化很重要
这对自动化有用,因为机器人不仅知道信号发生了。
它还知道信号发生的位置。
━━━━━━━━━━━━━━━━━━━━━━
参数
━━━━━━━━━━━━━━━━━━━━━━
所有参数按类别组织,方便您快速了解每个设置控制的内容。
━━━━━━━━━━━━━━━━━━━━━━
计算设置
━━━━━━━━━━━━━━━━━━━━━━
◆ 分析时间框架
• 选择用于构建剖面的时间框架。
• 此时间框架是构建剖面、检测POC和组织信号评分的基础。
示例:
• 每日 = 每天一个剖面
• H4 = 每四小时一个剖面
◆ 成交量模式
• 选择tick成交量的计算方式。
可用模式:
• Tick = 一个tick等于一个单位
• TickXSize = tick根据价格变动大小加权
Tick是简单模式。
TickXSize赋予价格变动更强的tick更高权重。
◆ 历史蜡烛
• 定义保留在图表上的所选分析时间框架的过去蜡烛数量。
• 更多蜡烛提供更多历史背景。
• 更少蜡烛使图表更轻量。
• 指标可能内部保留少量额外边距,以确保POC、突破和回测的正确计算。
━━━━━━━━━━━━━━━━━━━━━━
显示设置
━━━━━━━━━━━━━━━━━━━━━━
◆ 剖面显示模式
• 选择图表上显示的内容:
• 无
• 成交量剖面
• 气泡
• TPO
无适合自动化,因为它移除图表上的绘图,同时保持指标输出可用。
这允许交易者保持干净的图表,同时在机器人内使用信号。
◆ 显示POC
• 控制显示哪些POC水平。
可用选项:
• 无 = 无POC线
• PoC = 当前POC水平
• PoC过去 = 过去POC水平
• 全部 = 当前和过去POC水平
当前POC可以用虚线延伸到下一个分析蜡烛。
◆ 文本模式
• 控制蜡烛下方显示的成交量信息。
可用选项:
• 无 = 无文本
• Tick成交量 = tick成交量信息
• 差额百分比 = 以百分比显示的不平衡
为了自动化,可以设置为无以保持图表干净。
◆ 字体大小
• 控制显示文本的大小。
• 增大以提高可读性。
• 如果图表过于拥挤,请减小。
━━━━━━━━━━━━━━━━━━━━━━
剖面设置
━━━━━━━━━━━━━━━━━━━━━━
◆ 级别大小
• 控制每个价格级别的大小。
• 较小的值提供更多细节。
• 较大的值创建更清晰且更轻量的剖面。
• 指标包含安全机制以避免创建过多图表对象。
如果消息建议增加级别大小,表示指标正在保护图表免受不必要的负载。
在这种情况下,内部已应用安全的最小级别。
◆ 最大成交量的最小百分比
• 根据强度过滤区域。
• 指标首先找到蜡烛内最强的成交量区域。
• 然后仅保留达到该最大区域所选百分比的区域。
示例:
• 如果最大成交量的最小百分比设置为80%,则仅选择至少达到最高成交量区域80%的区域。
较低的值显示更多区域。
较高的值显示更少但更强的区域。
最大成交量的最小百分比是强度过滤器。
◆ 谷值下降百分比
• 检查POC是否明显孤立。
• 将POC视为山顶。
• 为确认其为真实峰值,指标检查周围成交量是否足够下降。
较低的值接受更多区域。
较高的值仅保留更干净且更分离的区域。
谷值下降是孤立过滤器。
━━━━━━━━━━━━━━━━━━━━━━
信号设置
━━━━━━━━━━━━━━━━━━━━━━
◆ 信号回溯
• 选择哪个已关闭的蜡烛提供用于当前突破和回测信号的POC。
可用值:
• 0 = 最近关闭的蜡烛
• 1 = 最近关闭蜡烛之前的蜡烛
• 2 = 更早之前
这允许交易者基于较新或较旧的POC参考测试信号。
◆ 过去回溯
• 定义扫描多少较旧的蜡烛以构建过去POC水平。
• 较高的值允许指标搜索仍可能重要的较旧POC区域。
━━━━━━━━━━━━━━━━━━━━━━
颜色设置
━━━━━━━━━━━━━━━━━━━━━━
◆ 剖面颜色
这些设置自定义视觉剖面的颜色:
• 买入颜色
• 卖出颜色
• 中性颜色
• 剖面不透明度
这些设置控制成交量剖面、气泡图和TPO元素的外观。
◆ POC颜色
这些设置自定义当前和过去POC水平的颜色:
• POC颜色
• 过去POC颜色
• POC不透明度
为当前POC和过去POC使用不同颜色,使图表更易读。
━━━━━━━━━━━━━━━━━━━━━━
此指标适合谁?
━━━━━━━━━━━━━━━━━━━━━━
此指标适用于:
◆ cTrader用户
◆ 成交量剖面交易者
◆ TPO交易者
◆ 气泡图用户
◆ POC交易者
◆ 算法交易者
◆ cBot开发者
◆ 希望获得视觉工具和机器人就绪输出的交易者
◆ 希望测试围绕成交量区域的突破与回测逻辑的交易者
━━━━━━━━━━━━━━━━━━━━━━
重要提示
━━━━━━━━━━━━━━━━━━━━━━
此指标不是魔法按钮。
它不预测市场。
它帮助交易者识别重要的市场区域,观察价格反应,并构建可以测试、优化和自动化的策略。
使用前请务必测试您的策略。
━━━━━━━━━━━━━━━━━━━━━━
The Quant
━━━━━━━━━━━━━━━━━━━━━━
The Quant 是一个专注于以下内容的交易和算法交易项目:
◆ 数据
◆ 自动化
◆ 回测
◆ 优化
◆ 防止过拟合
目标是帮助交易者将想法转化为可测试、结构化且可自动化的策略。
The Quant,数据信仰者的选择。
摘要
Designed for both manual traders and algorithmic developers, it supports cBot automation by providing break and retest signals of current and past POC levels, along with scoring to indicate the relative position of these zones to the candle open price. This facilitates the creation and testing of volume-based trading strategies.
Volume calculation can be set to simple tick counts or weighted by price movement size (TickXSize), enhancing the detection of impactful volume zones, especially in CFD markets where volume data is broker-dependent. The indicator offers customizable display modes, filtering parameters for volume zone strength and isolation, and color settings for clarity.
Intended for cTrader users interested in volume profile, TPO, bubble chart visualization, and automated trading strategies, it aids in identifying significant volume zones and price reactions without predicting market direction.
客户评价
5 | 100 % | |
4 | 0 % | |
3 | 0 % | |
2 | 0 % | |
1 | 0 % |


