
Candle Timer & Strength Demo
指标
268 下载
版本 1.0, Jul 2025
Windows 版、Mac 版
说明
主要特点:
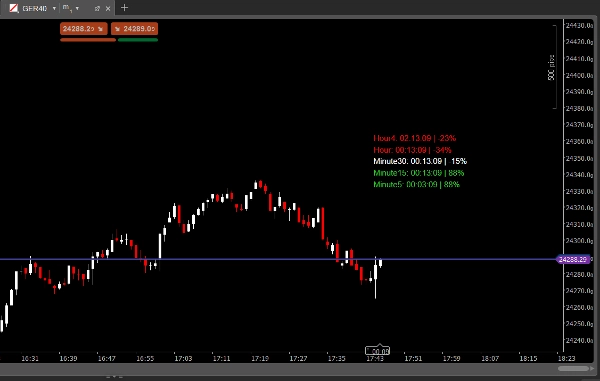
- 多时间框架蜡烛计时器:
在一个清晰的面板中查看最多5个选定时间框架的下一根蜡烛收盘倒计时。 - 蜡烛强度百分比:
即时查看每个时间框架当前蜡烛的强度(从-100%到+100%),基于收盘价相对于蜡烛范围的位置。 - 可定制面板:
-
- 设置字体大小、与最后一根蜡烛的距离和垂直间距。
- 选择您偏好的时间框架(M1、M5、M15、M30、H1、H4等)。
- 颜色自动变化:绿色表示强烈看涨,红色表示强烈看跌,白色表示中性。
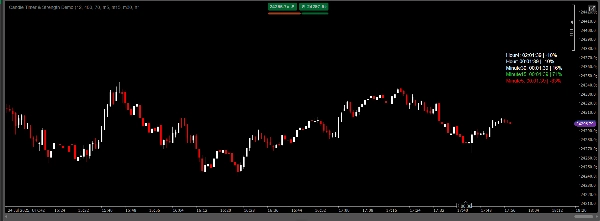
- 始终可见:
面板始终显示在您的图表上,使您能够一目了然地监控市场时机和动能。 - 完美适合:
-
- 需要精确蜡烛计时的剥头皮交易者和日内交易者。
- 希望在一个地方查看动能和时机的多时间框架交易者。
- 任何想要提升入场/出场时机和蜡烛阅读技巧的人。
工作原理:
- 指标计算每个选定时间框架当前蜡烛收盘剩余时间。
- 它还计算蜡烛强度的百分比:
-
- +100% = 收盘价位于蜡烛顶部(强烈看涨)
- -100% = 收盘价位于蜡烛底部(强烈看跌)
- 0% = 收盘价位于中间(中性)
- 面板实时更新,且完全可定制。
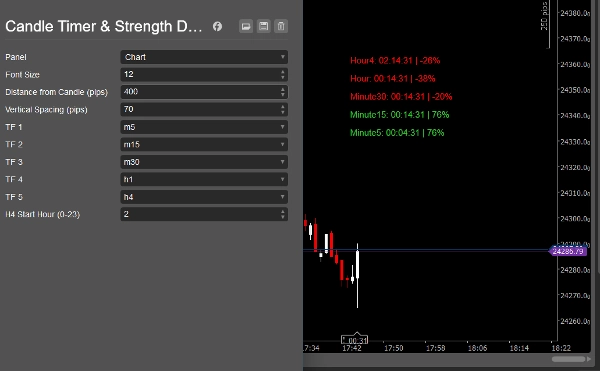
参数:
- 字体大小
- 与蜡烛的距离(点数)
- 垂直间距(点数)
- 时间框架1–5(自定义)
- H4起始小时(适用于非标准H4蜡烛的经纪商)
为什么选择蜡烛计时器和强度?
- 节省时间: 不再需要切换时间框架或在脑中计算蜡烛收盘时间。
- 自信交易: 即时查看市场动能是增强还是减弱。
- 专业外观: 干净、现代的面板适合任何图表风格。
- 易于使用: 即插即用,无需编码。
注意:
此演示仅供评估用途。
如果您喜欢此指标,请购买完整版以获得无限制使用权限。
要获取完整版,请在cTrader商店搜索“Candle Timer & Strength”。
查看我所有的指标和机器人:
https://ctrader.com/pl?search=kobud.222&u=kobud.222
http://www.youtube.com/@Robi22-22
📩 有问题?建议?折扣?
联系方式见我的个人资料:Robikobud
摘要
AI 摘要
Candle Timer & Strength Demo for cTrader is an indicator designed to display real-time countdowns to the close of current candles across up to five customizable timeframes. It provides a clear panel showing the remaining time until candle close and the candle’s strength as a percentage, ranging from -100% (strong bearish) to +100% (strong bullish), based on the candle’s close position relative to its range. The panel is fully customizable, allowing users to adjust font size, vertical spacing, distance from the last candle, and select preferred timeframes such as M1, M5, M15, M30, H1, and H4. Colors dynamically indicate momentum: green for strong bullish, red for strong bearish, and white for neutral. The panel remains always visible on the chart, facilitating quick assessment of market timing and momentum. This tool is suited for scalpers, day traders, and multi-timeframe traders seeking precise candle timing and momentum insights to improve entry and exit decisions. Parameters include font size, spacing, timeframe selection, and H4 start hour adjustment for brokers with non-standard candle timings. This demo version is intended for evaluation purposes.
指标配置
客户评价
0.0
评价:0
客户评价
该产品尚无评价。已经试过了?抢先告诉其他人!
讨论
常见问答
cTrader Store 提供的所有产品,包括交易机器人、指标和插件,均由第三方开发者提供,仅供信息参考和技术访问之用。cTrader Store 并非经纪商,不提供投资建议、个人推荐或任何未来业绩保证。
该作者的其他作品


猜您喜欢


价格
注册日期 31/12/2024
7
销售
1.14K
免费安装