
说明
概述
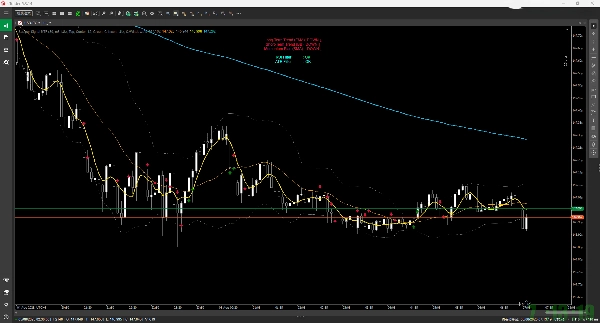
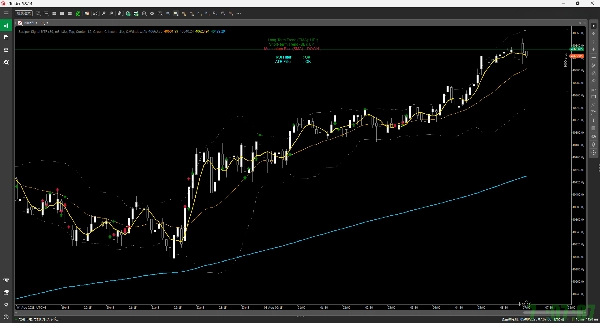
基于指定时间框架(例如5分钟)的技术指标,在当前图表上显示买入/卖出信号(箭头)。它还会在信号出现后模拟交易,并在潜在的退出点绘制一个标记(星形)。
主要功能
- 买入/卖出信号显示:
-
- 买入信号(向上箭头):基于SMA(简单移动平均线)金叉,结合RSI、200 EMA和布林带的条件来识别有利的买入机会。
- 卖出信号(向下箭头):基于SMA死叉,结合RSI、200 EMA和布林带的条件来识别有利的卖出机会。
- 交易模拟:
-
- 信号出现后,若满足以下任一条件,则假设交易已关闭,并在图表上用星形图标标记:
-
- 止盈/止损(基于ATR和指定的风险回报比)。
- 触及布林带(上轨/下轨或中线)。
- 超过最大持仓时间。
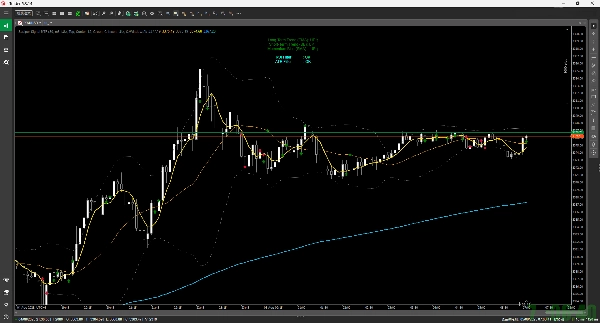
- 内部还计算了保本和移动止损。
- 仪表盘显示:
-
- 在图表左上角显示当前市场环境的简要摘要,包括长期趋势(EMA)、短期趋势(BB)和动量(SMA)。
- 提醒功能:
-
- 当生成新信号时提供声音通知。
参数
您可以在指标设置中自由自定义以下项目:
- 用于计算的时间框架(MTF)。
- 各指标的周期(SMA、RSI、BB、EMA)。
- 交易退出规则(例如风险回报比、最大持仓时间)。
- 信号和仪表盘的显示设置(可见性、颜色、大小)。
摘要
AI 摘要
Scalper Signal MTF is a custom indicator designed for the cTrader platform that provides multi-timeframe scalping signals. It analyzes technical indicators from a chosen timeframe—such as 5 minutes—and displays buy (up arrow) and sell (down arrow) signals on the current chart. Buy signals are generated based on an SMA golden cross combined with RSI, 200 EMA, and Bollinger Bands conditions; sell signals use an SMA dead cross with similar criteria.
The indicator simulates trades after signals appear and marks potential exit points with a star icon. Trade exits are triggered by take profit or stop loss levels (calculated using ATR and a specified risk-reward ratio), touching Bollinger Bands, exceeding maximum holding time, or internal breakeven and trailing stop calculations.
A dashboard on the chart’s top-left summarizes the current market environment, showing long-term trend (EMA), short-term trend (Bollinger Bands), and momentum (SMA). The indicator also provides sound alerts when new signals occur.
Users can customize the timeframe for calculations, indicator periods (SMA, RSI, BB, EMA), trade exit rules, and display settings including signal and dashboard visibility, colors, and sizes.
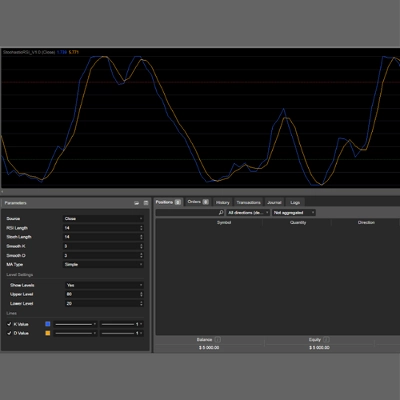
指标配置
客户评价
0.0
评价:0
客户评价
该产品尚无评价。已经试过了?抢先告诉其他人!
讨论
常见问答
cTrader Store 提供的所有产品,包括交易机器人、指标和插件,均由第三方开发者提供,仅供信息参考和技术访问之用。cTrader Store 并非经纪商,不提供投资建议、个人推荐或任何未来业绩保证。
该作者的其他作品


猜您喜欢


价格
1
销售
1.37K
免费安装