
说明
🚀 用精确的影线可视化改变您的Renko交易
解锁标准Renko图表无法显示的隐藏市场数据! 📈
✨ 这个指标有什么特别之处?
🎯 真实的逐笔分析 - 与其他猜测的指标不同,此工具分析每个Renko砖块内的每一笔成交,揭示形成过程中发生的实际价格极值。
🔍 发现别人忽略的细节 - 发现每个Renko砖块内发生的真实高点和低点,为更好的进出场决策提供关键市场洞察。
💪 使其与众不同的关键特性:
🏗️ 智能本地存储技术
- 自动保存所有计算出的影线到您的本地存储
- 永不丢失数据 - 即使切换图表、时间框架或重启cTrader也能保持数据完整
- 智能增量加载避免重复计算已有数据
- 平台重启时对性能影响最小
⚡ 极速性能
- 逐日渐进加载,实时显示进度
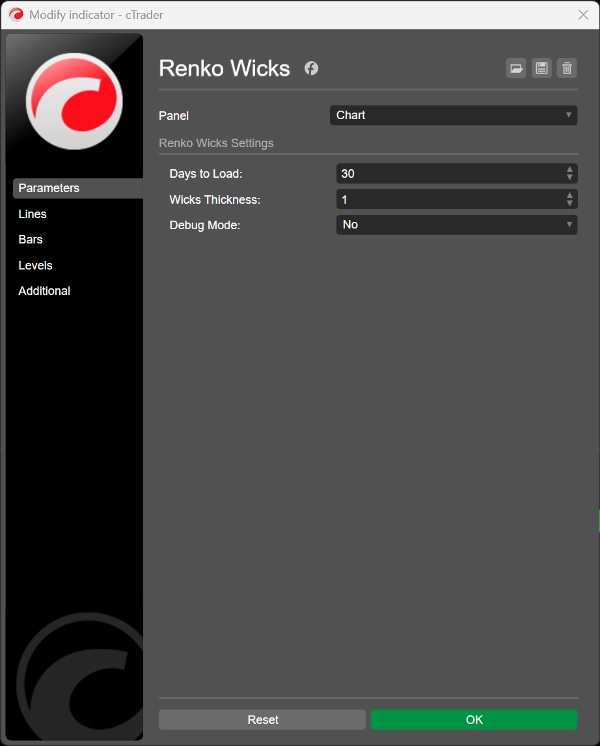
- 可配置的历史深度(1天以上)
- 优化内存使用,确保图表运行流畅
🎨 专业视觉设计
- 自动匹配您的图表多头/空头配色方案
- 可调节的影线粗细(1-5像素),确保完美可见性
- 简洁且不干扰的显示,提升您的分析体验
🛡️ 坚如磐石的可靠性
- 100% 数据持久性 - 您的影线数据在平台重启、图表切换和时间框架更改后依然保留
- 智能重复防护确保图表整洁
- 内置错误处理,确保最大稳定性
- 调试模式,便于透明化和故障排除
🎯 适合人群:
📊 日内交易者 - 捕捉日内极值,精准剥头皮机会
📈 波段交易者 - 识别Renko砖块内的关键支撑/阻力位
🔄 多时间框架分析 - 每个时间框架维护自己的影线数据库
🚨 为什么Renko影线很重要:
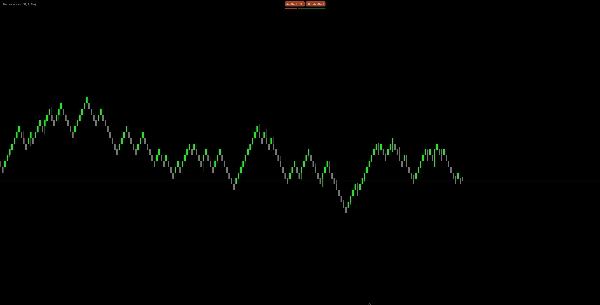
标准Renko图表只显示每个砖块的开盘和收盘价,但巨大的价格波动发生在其间! 此指标揭示了:
- 📉 真实的支撑/阻力位,价格实际触及的位置
- 🎪 市场波动性洞察,在每个砖块形成过程中
- 🎯 更好的进出场点,基于实际价格极值
- 📊 增强的市场结构分析,助您做出明智决策
由一位真正的Renko交易者制作 ♥
摘要
AI 摘要
Renko Wicks Pro is an indicator designed to enhance Renko chart analysis by displaying the true price wicks or tails within each Renko brick. Unlike standard Renko charts that show only open and close prices, this tool performs tick-level analysis to reveal actual intrabrick price extremes, providing deeper insights into market volatility and support/resistance levels.
Key features include smart local storage that preserves calculated wick data across chart switches, timeframes, and platform restarts, ensuring data persistence and minimizing recalculations. The indicator offers fast, progressive day-by-day data loading with configurable history depth and optimized memory usage for smooth performance. Visually, it adapts to the chart’s bull/bear color scheme and allows adjustable wick thickness for clear, non-intrusive display.
Renko Wicks Pro supports multiple timeframes, maintaining separate wick databases for each, making it suitable for day traders seeking precise scalping points and swing traders identifying key levels. It includes built-in error handling, duplicate prevention, and a debug mode for stability and troubleshooting.
By revealing hidden price movements within Renko bricks, this indicator aids in identifying true market structure, improving entry and exit decisions based on actual price extremes.
指标配置
客户评价
0.0
评价:0
客户评价
该产品尚无评价。已经试过了?抢先告诉其他人!
讨论
常见问答
cTrader Store 提供的所有产品,包括交易机器人、指标和插件,均由第三方开发者提供,仅供信息参考和技术访问之用。cTrader Store 并非经纪商,不提供投资建议、个人推荐或任何未来业绩保证。


价格
237.39M
交易量
1.82M
盈利点数
2
销售
4.58K
免费安装