
说明
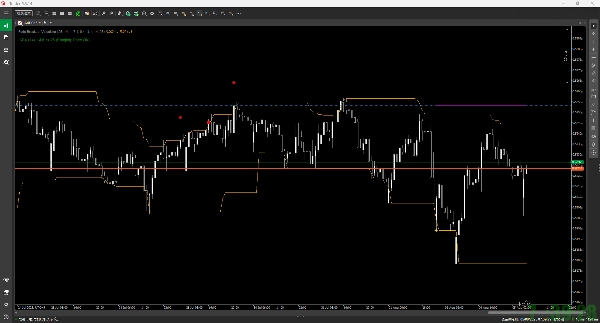
该指标是一个工具,用于在您的图表上可视化一种名为“Fade Breakout”的逆势策略的交易逻辑。它不执行实际交易,而是显示当信号出现时,头寸从入场到出场的管理方式。
主要特点
- 入场信号:
-
- 它利用了 Donchian Channel。
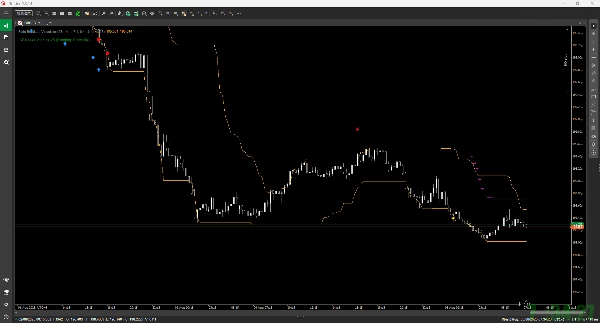
- 买入信号(逆势): 当价格跌破下轨 Donchian Channel 时,显示买入信号(蓝色向上箭头 ↑)。
- 卖出信号(逆势): 当价格突破上轨 Donchian Channel 时,显示卖出信号(红色向下箭头 ↓)。
- 风险管理:
-
- 入场时,会根据 ATR(平均真实波幅) 绘制初始止损(红色虚线)和第一个止盈(绿色虚线)。
- 当第一个止盈(TP1)触及时,会出现一个金色星星(★),止损移动至入场价(保本)。
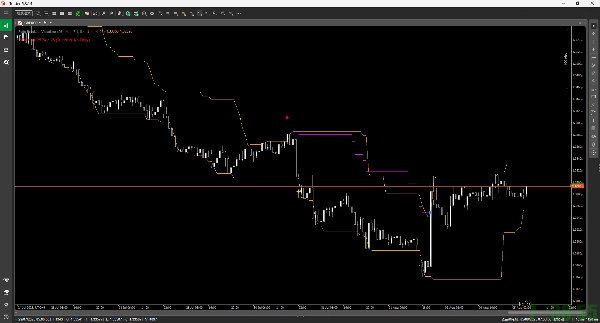
- 之后,基于 ATR 的 移动止损 启动,通过跟踪价格来锁定利润。移动止损路径显示为品红色线条。
- 交易退出:
-
- 止损: 如果价格触及止损位,用红色方块(■)标记。
- 移动止损退出: 如果价格触及移动止损,用蓝色方块(■)标记。
- ADX 过滤器:
-
- 您可以选择启用 ADX 过滤器。
- 如果 ADX 高于指定值(表示强趋势),将禁用新的入场信号。当前状态(入场允许 / 禁止入场)显示在图表左上角的文本中。
摘要
指标配置
客户评价
0.0
评价:0
客户评价
该产品尚无评价。已经试过了?抢先告诉其他人!
讨论
常见问答
cTrader Store 提供的所有产品,包括交易机器人、指标和插件,均由第三方开发者提供,仅供信息参考和技术访问之用。cTrader Store 并非经纪商,不提供投资建议、个人推荐或任何未来业绩保证。
该作者的其他作品


价格
1
销售
1.28K
免费安装