TRWatermark_v1.0
指标
216 下载
版本 1.0, Nov 2025
Windows 版、Mac 版
4.5
评价:2
说明
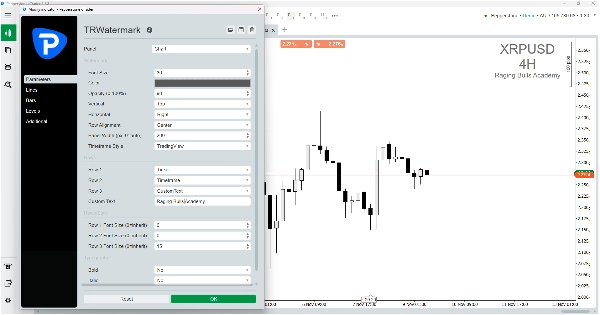
TR 水印(右上角水印)是 cTrader 的可定制图表水印。它显示重要的图表信息,如符号、时间框架、经纪商或交易所、蜡烛倒计时器或自定义文本,而不会遮挡价格蜡烛或绘图。
该指标允许将水印放置在图表的任意角落,为不同的布局偏好提供灵活性。
功能:
- 三个可配置的行。每行可以显示时间框架、符号、经纪商、自定义文本、倒计时,或保持为空。
- 支持 TradingView 和 MetaTrader 的时间框架格式。
- 可调位置:顶部、中部、底部及左、中、右。
- 每行字体大小和全局字体选项。
- 倒计时器显示当前蜡烛剩余时间。
- 可调节不透明度和对齐设置。
使用方法:
1. 将指标添加到 cTrader Automate 工作区。
2. 点击构建,然后将 TR 水印附加到任意图表。
3. 根据需要配置行和样式。
4. 可选地将指标导出为 .algo 文件。
关于名称:
TR 水印代表右上角水印。它的开发目的是让交易者在角落区域查看关键图表信息,而不是在中心位置,从而保持图表数据的可见性以便分析。
摘要
AI 摘要
TR Watermark (Top Right Watermark) is a customizable indicator for the cTrader platform designed to display key chart information unobtrusively in any corner of the chart. It shows details such as the trading symbol, timeframe, broker or exchange name, a live candle countdown timer, or custom text without overlapping price candles or drawings. The indicator features three configurable rows, each capable of displaying different information or remaining empty, supporting both TradingView and MetaTrader timeframe formats. Users can adjust the watermark’s position (top, middle, bottom; left, center, right), font sizes per row and globally, opacity, and alignment settings. Installation involves adding the indicator to the cTrader Automate workspace, building, and attaching it to a chart, followed by configuration of display rows and styles. The watermark helps traders keep essential chart data visible while maintaining a clear view of price action and technical analysis. It supports multiple markets including Forex, stocks, indices, commodities, and cryptocurrencies.
指标配置
客户评价
4.5
评价:2
5 | 50 % | |
4 | 50 % | |
3 | 0 % | |
2 | 0 % | |
1 | 0 % |
客户评价
January 20, 2026
A very useful tool to always know which instrument you’re viewing on the chart, especially since cTrader doesn’t offer a native solution for this. The ability to freely move the watermark around the screen is a great touch, as it prevents it from overlapping with the chart candles. Highly recommended.
November 24, 2025
TRWatermark_v1.0 is a clean and lightweight tool that adds customizable watermarks to your charts. Great for reports, streams, and organized multi-chart setups. Fast, stable, and easy to tweak. Could benefit from extra presets and more watermark styles, but it already does its job perfectly.
讨论
常见问答
BTCUSD
Prop
Forex
Indices
Commodities
Crypto
Stocks
XAUUSD
NAS100
cTrader Store 提供的所有产品,包括交易机器人、指标和插件,均由第三方开发者提供,仅供信息参考和技术访问之用。cTrader Store 并非经纪商,不提供投资建议、个人推荐或任何未来业绩保证。
猜您喜欢


!["[Hamster-Coder] Bollinger Bands" 标识](https://cdn.ctrader.com/image/webp/21d8e5d6-fb11-4bac-b9ee-cd05c2b76804_30327)


价格
注册日期 03/11/2025
10.24M
交易量
58.74K
盈利点数
216
免费安装