说明
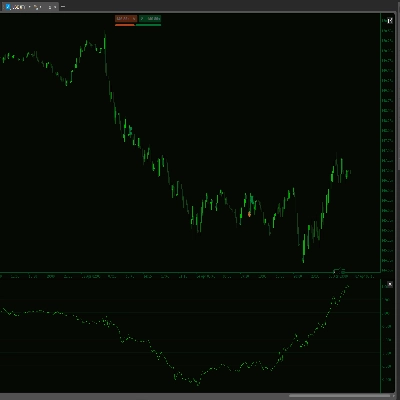
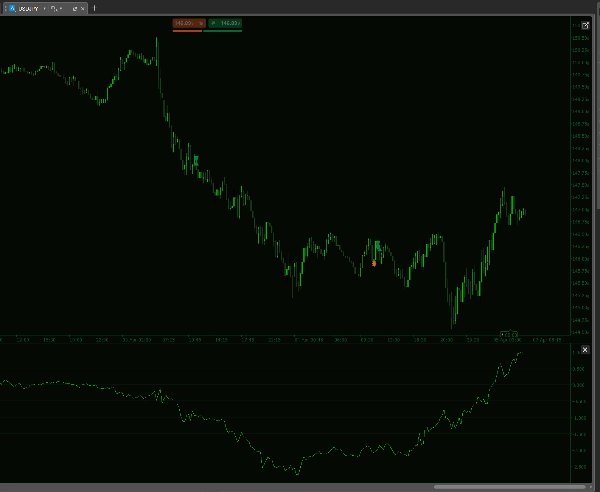
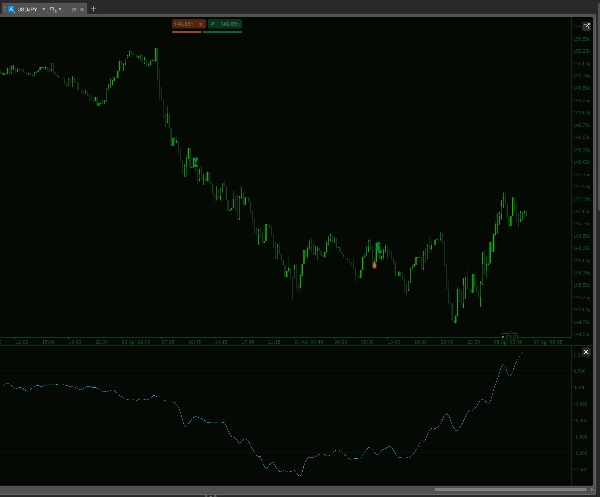
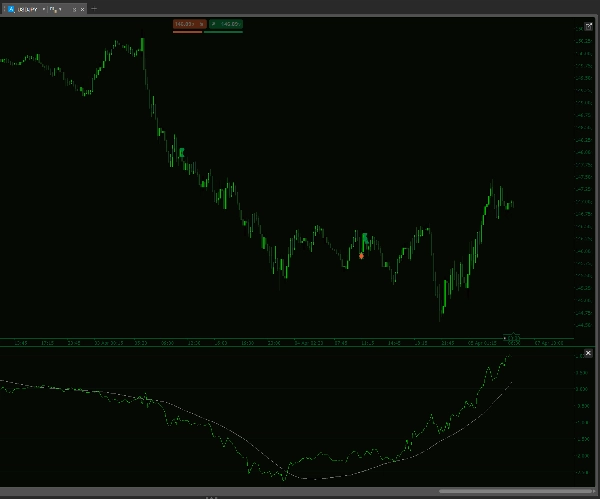
通过历史DXY HMA指标提升您的交易策略——这是一款为精确性和性能而设计的先进cTrader工具。该高级指标通过结合六个主要货币对的加权百分比变化,计算出自定义的美元指数,为您提供动态且可靠的市场衡量标准。
主要特点:
- 自定义DXY计算: 集成六个主要美元货币对(EURUSD、USDJPY、GBPUSD、USDCAD、USDCHF、USDSEK),并可配置权重,实现精细调校的指数。
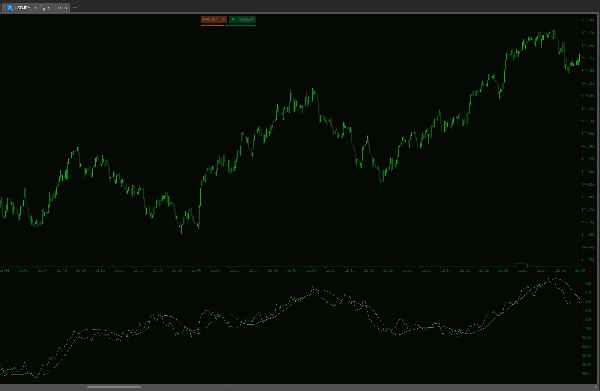
- 双重Hull移动平均线: 采用短期和长期Hull移动平均线,清晰展示市场趋势和动能。
- 斜率平滑处理: 通过平滑的斜率HMA增强趋势检测,助您更好地识别市场反转。
- 强大的数据处理: 无缝同步您的cTrader平台,确保即使面对不同数据源也能进行准确的实时分析。
- 可定制参数: 精细调整回溯计数和移动平均周期,完美匹配您的交易风格和市场状况。
历史DXY HMA指标专为现代交易者设计,将复杂的市场数据简化为可操作的洞见,使您能够做出更聪明、更自信的交易决策。体验市场分析的新高度!
--------------------------
欢迎查看我的其他指标!
https://ctrader.com/products/1181
https://ctrader.com/products/1182
https://ctrader.com/products/1180
https://ctrader.com/products/1015
https://ctrader.com/products/555
https://ctrader.com/products/553
https://ctrader.com/products/554
https://ctrader.com/products/552
https://ctrader.com/products/557
https://ctrader.com/products/845
https://ctrader.com/products/848
https://ctrader.com/products/847
https://ctrader.com/products/846
https://ctrader.com/products/551
https://ctrader.com/products/574
https://ctrader.com/products/573
https://ctrader.com/products/556
https://ctrader.com/products/558
https://ctrader.com/products/559
https://ctrader.com/products/560


!["High-Low Divergence [Iridio Capital]" 标识](https://cdn.ctrader.com/image/webp/443c4661-7abb-40f1-842f-4b6ec560649b_40914)


!["[Stellar Strategies] Inside Bar with Signals" 标识](https://cdn.ctrader.com/image/webp/1d9e8bfa-3b2c-4440-bb37-5856902008a7_30683)


