Penerangan
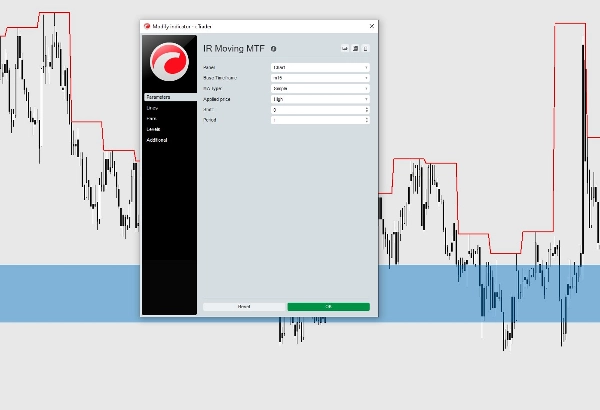
Purata Pergerakan Pelbagai Bingkai Masa adalah penunjuk yang kuat dan fleksibel untuk cTrader yang membolehkan anda memaparkan Purata Pergerakan yang dikira dari mana-mana bingkai masa terus pada carta semasa anda.
Tidak seperti penunjuk Purata Pergerakan standard, versi ini menyediakan pilihan penyesuaian lanjutan, menjadikannya sesuai untuk pedagang yang menggunakan analisis pelbagai bingkai masa dalam strategi perdagangan mereka.
Ciri-ciri
- Memaparkan Purata Pergerakan dari mana-mana bingkai masa pada carta semasa.
- Menyokong pelbagai kaedah Purata Pergerakan:
-
- Ringkas (SMA)
- Eksponen (EMA)
- Dihaluskan (SMMA)
- Berbobot Linear (LWMA)
- Wilder's
- Pilih dari pelbagai sumber harga:
-
- Tutup
- Buka
- Tinggi
- Rendah
- Harga Median
- Harga Tipikal
- Harga Berbobot
- Tempoh Purata Pergerakan yang boleh disesuaikan.
- Alih (Offset) Purata Pergerakan ke hadapan atau ke belakang.
- Warna, ketebalan, dan gaya garis yang boleh disesuaikan sepenuhnya.
- Pengiraan pelbagai bingkai masa yang tepat dengan visualisasi yang lancar.
- Berfungsi pada semua simbol dan semua bingkai masa.
Sesuai Untuk
Penunjuk ini sangat berguna untuk pedagang yang:
- Berdagang menggunakan analisis pelbagai bingkai masa.
- Menggunakan tren bingkai masa yang lebih tinggi untuk pengesahan kemasukan.
- Ingin memantau tahap sokongan dan rintangan dinamik.
- Menggabungkan Purata Pergerakan dengan strategi Tindakan Harga.
Sama ada anda seorang scalper, pedagang harian, atau pedagang ayunan, penunjuk ini membantu anda memvisualisasikan arah pasaran bingkai masa yang lebih tinggi tanpa perlu bertukar antara carta.
Untuk menyokong kami bagi lebih banyak penunjuk percuma sila gunakan pautan di bawah dan daftar dengan broker
🇮🇷 توضیحات فارسی
مووینگ اوریج مولتی تایمفریم
اندیکاتور Multi Time Frame Moving Average یک ابزار حرفهای برای cTrader است که به شما امکان میدهد مووینگ اوریج هر تایمفریمی را مستقیماً روی چارت فعلی نمایش دهید.
برخلاف مووینگ اوریج پیشفرض سیتریدر، این اندیکاتور امکانات بیشتری برای شخصیسازی در اختیار شما قرار میدهد و برای معاملهگرانی که از تحلیل چند تایمفریمی استفاده میکنند بسیار کاربردی است.
امکانات
- نمایش مووینگ اوریج هر تایمفریم روی چارت فعلی
- پشتیبانی از انواع مووینگ اوریج:
-
- SMA
- EMA
- SMMA
- LWMA
- Wilder's Moving Average
- انتخاب نوع قیمت محاسبه:
-
- Close
- Open
- High
- Low
- Median Price
- Typical Price
- Weighted Price
- قابلیت تنظیم دوره (Period)
- امکان جابهجایی (Shift/Offset) مووینگ اوریج به جلو یا عقب
- تنظیم کامل رنگ، ضخامت و استایل خط
- محاسبات دقیق در حالت Multi Time Frame
- قابل استفاده روی تمام نمادها و تمام تایمفریمها
مناسب برای
این اندیکاتور برای معاملهگرانی مناسب است که:
- از تحلیل چند تایمفریمی استفاده میکنند.
- روند تایمفریمهای بالاتر را برای تأیید ورود بررسی میکنند.
- از مووینگ اوریج بهعنوان حمایت و مقاومت داینامیک استفاده میکنند.
- استراتژی معاملاتی آنها بر پایه Price Action و Moving Average است.
این ابزار به شما کمک میکند بدون نیاز به جابهجایی بین تایمفریمها، روند تایمفریمهای بالاتر را مستقیماً روی نمودار فعلی مشاهده کنید.


![Logo "[Stellar Strategies] Smart ADX"](https://cdn.ctrader.com/image/webp/af13b084-b6f6-41db-b7bc-c7e688b57b05_36929)