present
Zarejestruj się i otrzymaj 50 $ zniżki na pierwszy zakup
Trading product for IR VLine Wskaźnik, image 1
IR VLine
5.0
Opinie: 1
5.66K
Bezpłatne instalacje

Opis

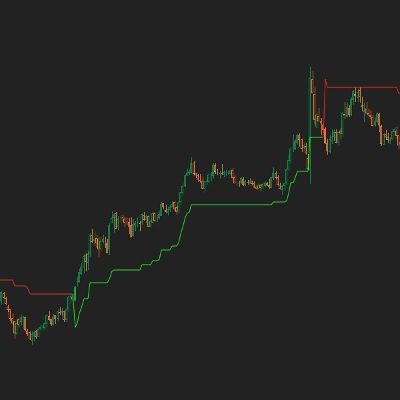
nie przesuwaj się na koniec wykresu po zmianie interwału czasowego.

lepiej używać do niedawnej historii. dla długiej historii występuje opóźnienie.

Podsumowanie

Podsumowanie AI
IR VLine is a chart indicator designed to maintain the current chart position without automatically moving to the end after changing the timeframe. It is optimized for analyzing recent market history, providing timely visual references for near-term data. When applied to longer historical periods, users may experience some delay in updates. This tool supports traders who require stable chart positioning during timeframe adjustments for short-term analysis.
Profil wskaźnika

Dyskusja

Opinie klientów

5.0
Opinie: 1
5
100 %
4
0 %
3
0 %
2
0 %
1
0 %
Opinie klientów
September 30, 2025
Very useful and handy tool

Częste pytania

Produkty dostępne za pośrednictwem cTrader Store, w tym boty handlowe, wskaźniki i wtyczki, dostarczane są przez deweloperów zewnętrznych i udostępniane wyłącznie w celach informacyjnych oraz w celu zapewnienia dostępu technicznego. cTrader Store nie jest brokerem i nie zapewnia doradztwa inwestycyjnego, nie udziela spersonalizowanych rekomendacji ani nie gwarantuje przyszłych wyników.

Więcej od tego autora
Logo „IR Candle MTF”
4.6
(6)
Za darmo
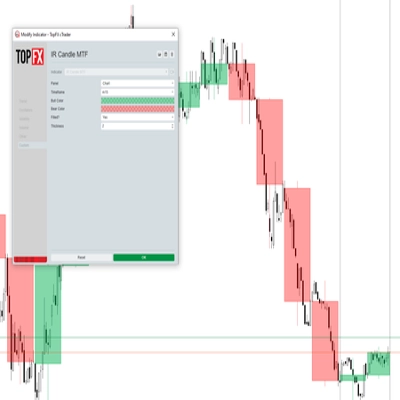
with this indicator you could see other time frame candle in your chart.
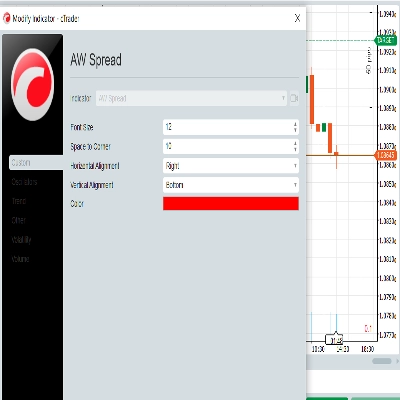
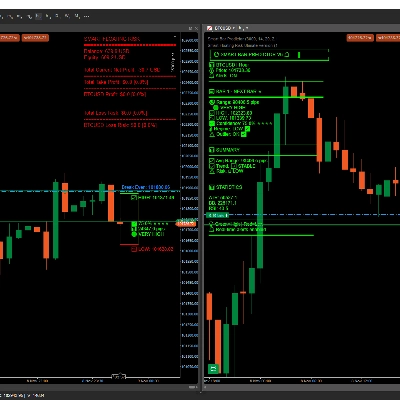
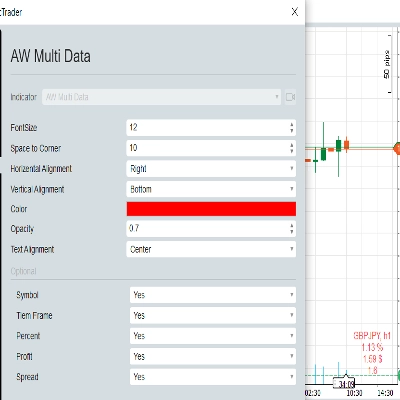
show spread on chart
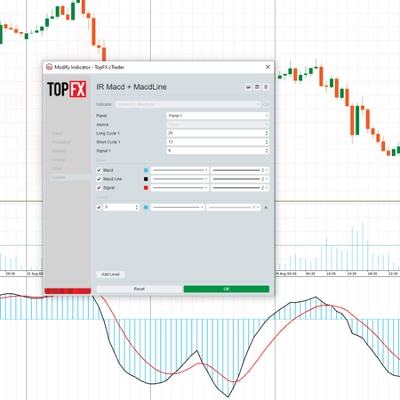
some user add moving average to macd to see better. in ctrader 4.3.11 there is a problem with this . I make a macd tha
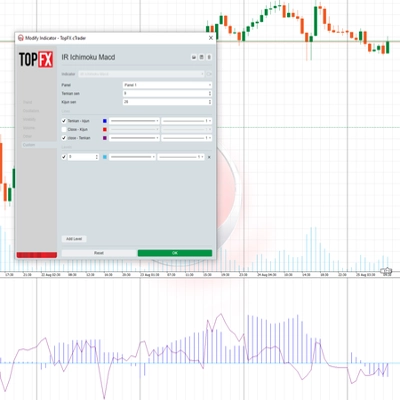
this indicator show macd on chart.
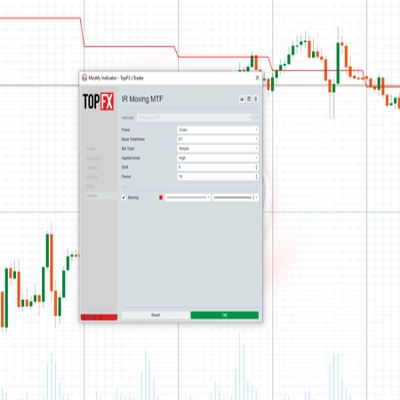
Multi Time Frame Moving Average is a powerful and flexible indicator for cTrader
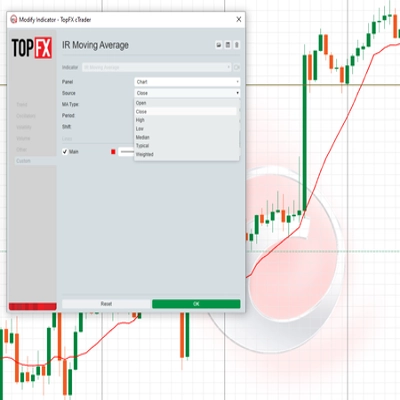
 this moving include everything that a trader needs from Moving Average.
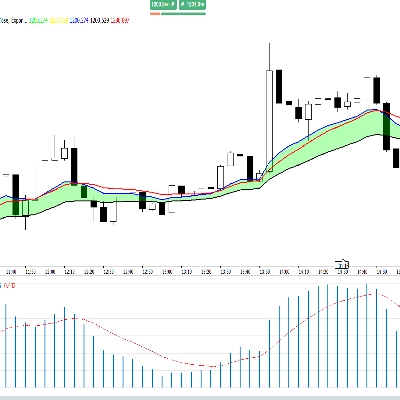
this indicaotr show distance between Tenkan to Kijun, Close to Kijun and Close to Tenkan 
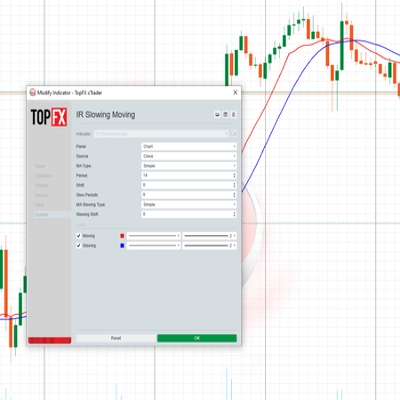
Add Slowing to IR Moving Average.
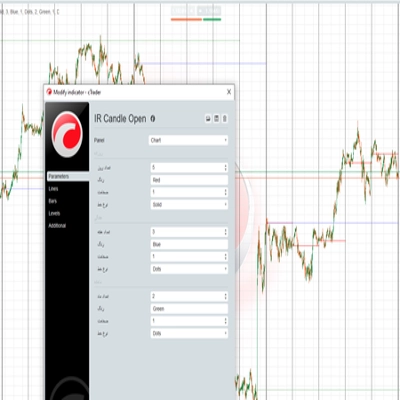
IR Candle Open plots customizable opening price lines for daily, weekly, and monthly candles
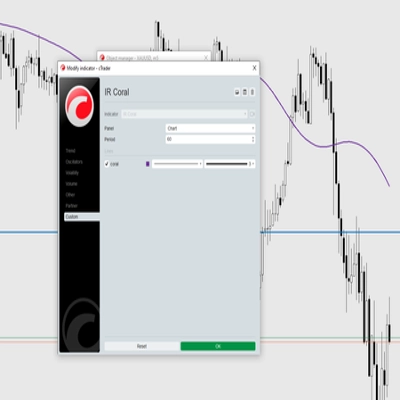
Coral indicator
you could put your check list in your chart you could split your test with “,” you could put your checklist in indicat
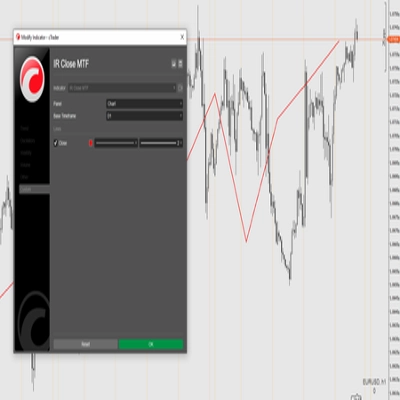
this indicator show other time frame close in lower time frame. for ex: show daily close in m 15.

Możesz także polubić

Volume Profile Price Period and Live VAH,VAL,POC,
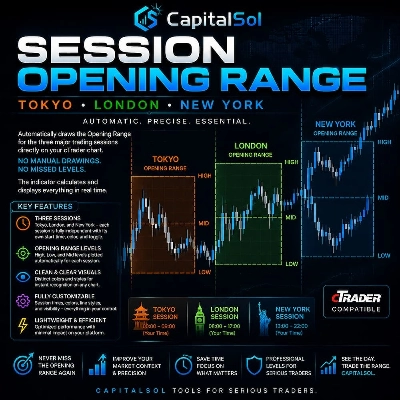
Automatically draws the Opening Range (High & Low) for Tokyo, London, and New York sessions. Configurable start times,
Stochastic Momentum Index (SMI) for cTrader optional higher-timeframe source, and clear overbought/oversold levels.
Super Wick detects powerful candle rejections: fractal long-wicks, HTF resonance zones, and a WSI gauge.
an all-in-one Smart Money Concepts (SMC) toolkit featuring Premium/Discount zones.
Enhance your trading strategy with our customizable TradingViewMACD indicator. Optimize and elevate your market analysis
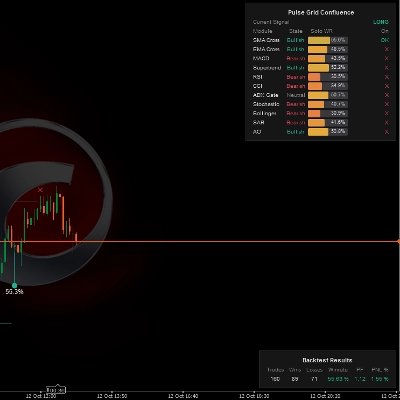
Multi-indicator confluence HUD & real-time backtest engine to detect trend alignment and filter high-probability setups.
Multi-timeframe version of the Quantitative Qualitative Estimation (QQE) indicator.
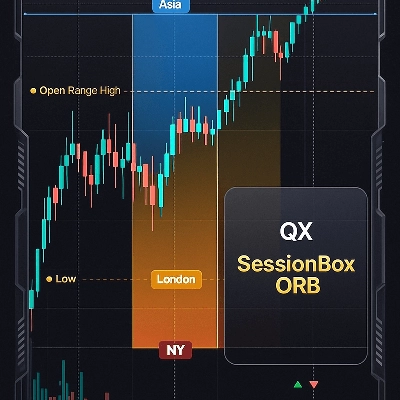
QX SessionBox ORB: Session boxes + ORB levels + clean dashboard with optional closed-candle breakout signals.
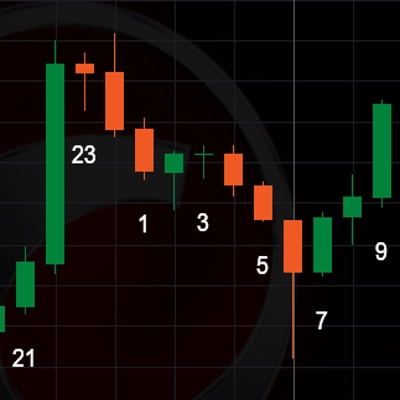
Counts bars from the start of the sessions.
Delta RSI Candle Pro, the indicator that transforms ordinary candlesticks into powerful momentum visualizers.
Logo „Candlehtf”
4.2
(4)
$19
/
$20
MultiFrameCandles para cTrader: La Herramienta Definitiva para Dominar Cualquier Marco de Tiempo
Angora Pattern Recognition is a cTrader indicator that finds, draws and tracks classic chart patterns automatically.
PRO Liquidity Sweep + FVG Combo detector with custom Gold/Blue signals & alerts
The Dominator SMC Base, Smart Money Concept Indicator.
Logo „UT Bot”
4.4
(5)
$19
/
$20
Trend-following indicator with dynamic ATR-based trailing stop for precise entry/exit signals
🔮 Smart Bar Predictor - Professional Volatility Forecasting Indicator
Nine timeframe cards, vivid candles, native BUY/SELL arrows and adjustable ATR-buffer stop-loss reference lines.

Cena

5.66K
Bezpłatne instalacje