
Description
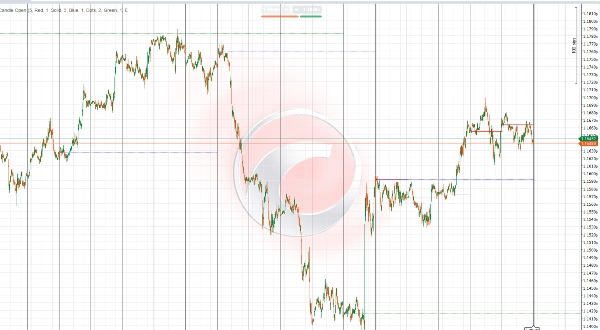
IR Candle Open Indicator est un outil polyvalent et personnalisable qui trace les prix d'ouverture des chandeliers hebdomadaires, journaliers et mensuels sur votre graphique de trading. Les traders peuvent sélectionner le nombre de périodes (jours, semaines, mois) à afficher, permettant une analyse multi-échelle flexible adaptée à leur stratégie.
Les principales caractéristiques incluent :
- Tracé précis des ouvertures de chandeliers pour un nombre défini par l'utilisateur de périodes journalières, hebdomadaires et mensuelles.
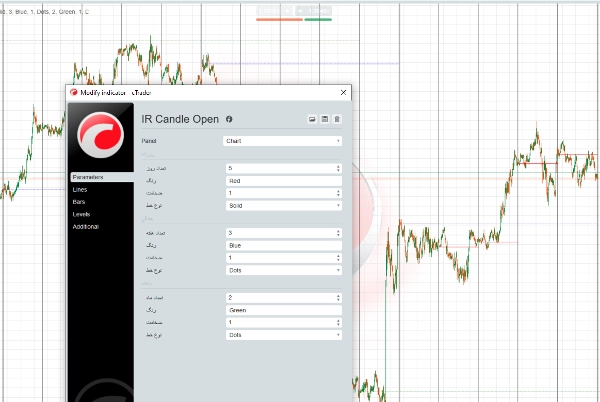
- Styles de ligne personnalisables : les utilisateurs peuvent choisir le type de ligne (continue, en tirets, en points), la couleur et l'épaisseur pour une meilleure lisibilité du graphique.
- Prise en charge de la visualisation multi-échelle pour aider à identifier les niveaux de prix importants sur différents horizons temporels.
- Aide à repérer les zones potentielles de support et de résistance basées sur ces prix d'ouverture critiques.
- Compatible avec divers marchés tels que le Forex, les matières premières, les indices et les cryptomonnaies.
Cette flexibilité permet aux traders d'adapter l'affichage de l'indicateur à leurs préférences personnelles et à leur style de trading, améliorant ainsi la clarté et facilitant la prise de décision basée sur des niveaux de prix cruciaux.
توضیح فارسی (بهروز شده)
اندیکاتور IR Candle Open ابزاری منعطف و قابل تنظیم است که قیمتهای باز شدن کندلهای هفتگی، روزانه و ماهیانه را روی نمودار معاملاتی شما نمایش میدهد. کاربران میتوانند تعداد دورههای روزانه، هفتگی و ماهیانه که میخواهند خطوط آنها نمایش داده شود را انتخاب کنند تا تحلیل چندتایمفریمی متناسب با سبک معاملاتی خود داشته باشند.
ویژگیهای کلیدی:
- نمایش دقیق خطوط قیمت باز شدن کندلها برای تعداد دورههای دلخواه در تایمفریمهای روزانه، هفتگی و ماهیانه.
- امکان انتخاب نوع خط (ساده، خطچین، نقطهچین)، رنگ و ضخامت خطوط برای بهبود وضوح و خوانایی نمودار.
- پشتیبانی از تحلیل چندتایمفریمی جهت شناسایی سطوح مهم قیمتی در بازههای زمانی مختلف.
- کمک به تشخیص سطوح حمایت و مقاومت احتمالی بر اساس این نقاط کلیدی باز شدن قیمتها.
- مناسب برای استفاده در بازارهای مختلف مانند فارکس، کالاها، شاخصها و رمزارزها.
این قابلیتها به تریدرها امکان میدهد تا نمایش اندیکاتور را بر اساس سلیقه و سبک معاملاتی خود تنظیم کنند و با وضوح بیشتر، تصمیمات بهتری بگیرند.
Résumé
Avis clients
5 | 100 % | |
4 | 0 % | |
3 | 0 % | |
2 | 0 % | |
1 | 0 % |


