present
Đăng ký và nhận ưu đãi $50 cho lần mua đầu tiên
Trading product for IR Moving Average Chỉ báo, image 1
IR Moving Average
5.0
Đánh giá: 1
5.64K
Cài đặt miễn phí

Mô tả

chuyển động này bao gồm mọi thứ mà một nhà giao dịch cần từ Đường Trung Bình Động.

Loại Giá: Mở,Đóng,Cao,Thấp, Trung vị,Điển hình,Có trọng số

Hỗ trợ tất cả các loại đường trung bình động.

Tóm tắt

Tóm tắt AI
IR Moving Average is a comprehensive moving average indicator designed to meet traders' needs. It supports all types of moving averages and allows calculation based on various price types, including Open, Close, High, Low, Median, Typical, and Weighted prices. This flexibility enables users to tailor the indicator to different trading strategies and market conditions.
Hồ sơ chỉ báo

Thảo luận

Đánh giá của khách hàng

5.0
Đánh giá: 1
5
100 %
4
0 %
3
0 %
2
0 %
1
0 %
Đánh giá của khách hàng
August 12, 2025
Pros: Flexible moving average with multiple calculation methods, lightweight, stable on all timeframes. Cons: No alerts, no MTF mode, no preset saving.

Câu hỏi thường gặp

Các sản phẩm có sẵn trên cTrader Store, bao gồm bot giao dịch, chỉ báo và plugin, được cung cấp bởi các nhà phát triển bên thứ ba và chỉ nhằm mục đích cung cấp thông tin và tiếp cận kỹ thuật. cTrader Store không phải là nhà môi giới và không cung cấp lời khuyên đầu tư, khuyến nghị cá nhân hay bất kỳ đảm bảo nào về hiệu suất trong tương lai.

Sản phẩm khác của tác giả này

with this indicator you could see other time frame candle in your chart.
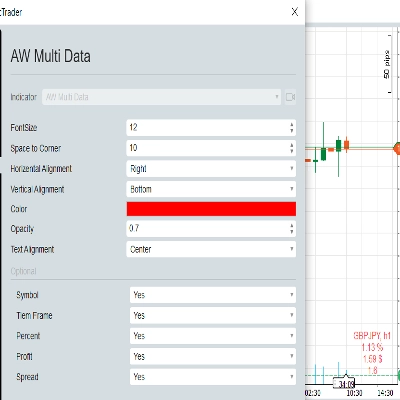
show spread on chart
some user add moving average to macd to see better. in ctrader 4.3.11 there is a problem with this . I make a macd tha
this indicator show macd on chart.
Multi Time Frame Moving Average is a powerful and flexible indicator for cTrader
this indicaotr show distance between Tenkan to Kijun, Close to Kijun and Close to Tenkan 
Add Slowing to IR Moving Average.
IR Candle Open plots customizable opening price lines for daily, weekly, and monthly candles
Coral indicator
you could put your check list in your chart you could split your test with “,” you could put your checklist in indicat
this indicator show other time frame close in lower time frame. for ex: show daily close in m 15.
don't move to the end of chart after timeframe changing. it should be better to use for near history. for long history

Bạn cũng có thể thích

A simple indicator that tracks the value of your open trades in pips.
Draw and manage multiple fixed-range volume profiles with persistent levels, developing POC/VA and smart alerts.
🚀 Automated Elliott Wave & Fibonacci tool for cTrader. Spot trends, corrections & retracements fast.
MACD Colour Histogram with 11 Moving Average Types, Multi-timeframe confirmation and Sound Signal Alert.
Angora Pattern Recognition is a cTrader indicator that finds, draws and tracks classic chart patterns automatically.
The Smart Money Concepts indicator is an all-in-one overlay tool that automatically detects OB, FVG ecc..
Follow The Trend cBot - INDICATOR - displays two Moving Average Bands for cBot or for your own use
Volume profile key levels - POC, value area, volume peaks and troughs - with break, rejection and retest signals
Fusion trend line with a layered cloud, BULL and BEAR labels, scored re-entry triangles and exit markers.
WinSMC is an overlay SMC indicator for cTrader. It helps you visually identify!
BB Breakout Oscillator with alerts! Spot trend reversals using Bollinger Bands. Bullish/Bearish crossovers Alerts.
Logo "ADT_bigCandles"
4.7
(4)
$20
/
$40
Outside Candle Detector: Highlights major candles/zones with ATR filter & pattern labels. By Avydel Talbo, prop trader.
Trading.FC$_vwap Algo shows VWAP trends, dynamic support/resistance and deviation bands to spot potential trade entries.
One of the best indicators we have ever developed, with a very high profit ratio.
Identifies market compression zones and explosive Breakout moments using mathematical modeling.
Opening ranges, dynamic trend channels, and multi-scale breakout/retest analysis for clear intraday chart decisions.
Market structure signals graded A to C, each with a drawn trade plan, plus an adaptive trend ribbon and a trend matrix
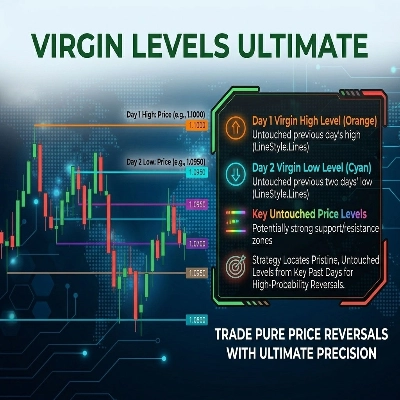
Tracks virgin levels. Lines vanish only after a candle closes beyond the high/low on your chosen timeframe.

Giá

5.64K
Cài đặt miễn phí