
FVG_tidypips
อินดิเคเตอร์
13 การซื้อ
เวอร์ชัน 1.0, Nov 2024
Windows, Mac
4.3
รีวิว: 3

คำอธิบาย
ตัวบ่งชี้ช่องว่างมูลค่ายุติธรรม (FVG) นี้เป็นเครื่องมือวิเคราะห์ทางเทคนิคที่ช่วยให้เทรดเดอร์ระบุความไม่สมดุลของราคาได้
คุณสมบัติ:
- สลับการแสดงผลของช่องว่างขาขึ้นและ/หรือขาลง
- แสดงกล่องที่มีสีรหัสเพื่อการมองเห็นที่ง่าย (ค่าเริ่มต้น: สีเขียวสำหรับขาขึ้น สีแดงสำหรับขาลง สีทองสำหรับระดับกึ่งกลาง)
- ปรับช่วงเวลาย้อนหลังได้เพื่อลดความยุ่งเหยิงของกราฟ
- ตั้งค่าการขยายกล่อง (offset) ได้เพื่อการมองเห็นที่ดีขึ้น
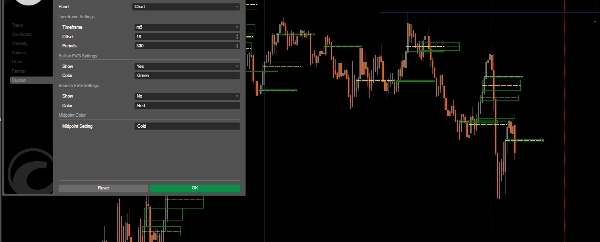
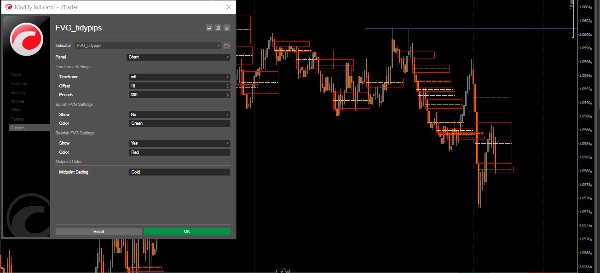
พารามิเตอร์:
- กรอบเวลา: เลือกกรอบเวลาที่คุณต้องการแสดง FVG
- Offset: ปรับการขยายแนวนอนของกล่อง FVG (3-500)
- ช่วงเวลา: ตั้งค่าช่วงเวลาย้อนหลังสำหรับการคำนวณ FVG ในอดีต
- แสดง FVG ขาขึ้น/ขาลง
- สี: ปรับแต่งสีสำหรับ FVG ขาขึ้น, FVG ขาลง และเส้นกึ่งกลาง
การใช้งานในการเทรด:
- แนวรับและแนวต้าน: FVG มักทำหน้าที่เป็นระดับแนวรับ/แนวต้านที่แข็งแกร่ง
- แม่เหล็กราคา: ช่องว่างที่ยังไม่ถูกเติมมักดึงดูดการเคลื่อนไหวของราคา (DOL)
- โครงสร้างตลาด: ช่วยระบุโซนกลับตัวที่เป็นไปได้และจุดต่อเนื่องที่น่าสนใจ
- การวิเคราะห์บล็อกคำสั่ง: ระบุโซนการเทรดของสถาบัน
แนวทางปฏิบัติที่ดีที่สุดในการใช้งาน:
- ใช้ร่วมกับเครื่องมือวิเคราะห์ทางเทคนิคอื่นๆ
- กรอบเวลาที่สูงกว่าจะให้ FVG ที่มีความสำคัญมากกว่า กรอบเวลาที่ต่ำใช้ร่วมกับทิศทางแนวโน้มของกรอบเวลาที่สูงกว่า
- ติดตามการตอบสนองของราคาขณะกลับมาที่โซน FVG
- ให้ความสนใจกับเส้นกึ่งกลางเนื่องจากมักทำหน้าที่เป็นแม่เหล็กราคา
ตรวจสอบตัวบ่งชี้ที่มีประโยชน์อื่นๆ ที่ฉันได้เผยแพร่ หากคุณพบว่าตัวนี้หรือเครื่องมืออื่นๆ ของฉันมีประโยชน์ โปรดสนับสนุนงานของฉันโดยการซื้อหรือบริจาค การสนับสนุนของคุณไม่เพียงช่วยให้ฉันพัฒนาปรับปรุงเครื่องมือเหล่านี้ต่อไป แต่ยังทำให้ฉันสามารถสร้างตัวบ่งชี้ใหม่ๆ ที่มีคุณค่าเพื่อเพิ่มประสบการณ์การเทรดของคุณ ขอบคุณสำหรับการสนับสนุนอย่างต่อเนื่อง!
https://buymeacoffee.com/tidypips
สรุป
สรุปโดย AI
The FVG_tidypips indicator is a technical analysis tool designed to identify Fair Value Gaps (FVGs), which represent price imbalances on trading charts. It visually highlights bullish and bearish gaps using color-coded boxes—green for bullish, red for bearish, and gold for midpoint levels—facilitating quick recognition of potential support and resistance zones. Users can toggle the visibility of bullish and/or bearish gaps, adjust the lookback period to manage chart clutter, and configure the horizontal extension (offset) of the FVG boxes for clearer visualization.
Key parameters include selecting the timeframe for FVG display, setting the offset range (3–500), defining the lookback period for historical gap calculation, and customizing colors for different gap types and midpoint lines. The indicator supports trading applications such as identifying strong support/resistance levels, spotting price magnets where unfilled gaps attract price action, analyzing market structure for potential reversal or continuation zones, and detecting institutional order block areas.
Best practices recommend using this indicator alongside other technical tools, focusing on higher timeframes for more significant FVGs, and monitoring price reactions when revisiting FVG zones. The midpoint line is noted as an important price magnet. This tool is applicable across various markets, including commodities like gold (XAUUSD).
โปรไฟล์อินดิเคเตอร์
รีวิวจากลูกค้า
4.3
รีวิว: 3
5 | 33 % | |
4 | 67 % | |
3 | 0 % | |
2 | 0 % | |
1 | 0 % |
รีวิวจากลูกค้า
November 22, 2024
Good idea with limits for traders who use ICT or SMC concepts. It gives value around smart money style analysis, but zones still need manual validation. A good sample is 20 FVG or order block reactions, with messy 0.705 areas skipped. The zone is more convincing when structure and risk both make sense.
November 21, 2024
November 21, 2024
Small but practical edge for smart money style analysis. it adds structure around liquidity, gaps and market shifts, especially when used for mapping zones before entries. For SMC logic, I trust zones more when 0.5 mitigation, BOS and liquidity sweep line up. The zone is more convincing when structure and risk both make sense.
การสนทนา
คำถามที่พบบ่อย
Commodities
XAUUSD
ผลิตภัณฑ์ที่มีให้บริการผ่าน cTrader Store รวมถึงบอทการเทรด อินดิเคเตอร์ และปลั๊กอิน มีให้บริการโดยนักพัฒนาบุคคลที่สามและมีไว้เพื่อวัตถุประสงค์ในการเข้าถึงข้อมูลและทางเทคนิคเท่านั้น cTrader Store ไม่ใช่โบรกเกอร์และไม่ได้ให้คำแนะนำการลงทุน คำแนะนำส่วนบุคคล หรือการรับประกันผลการดำเนินงานในอนาคต
เพิ่มเติมจากผู้เขียนคนนี้


ราคา
15
การขาย
4.63K
ติดตั้งฟรี