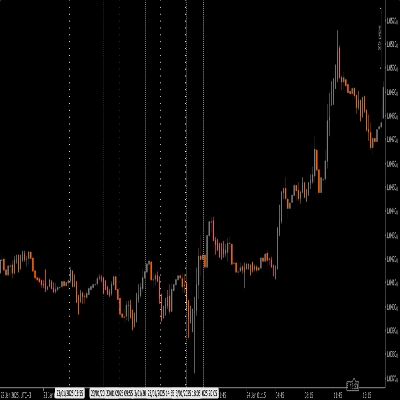
IR Macd + MacdLine
Logo "IR Macd + MacdLine"
5.0
03/09/2025
313
Desktop

some user add moving average to macd to see better.

in ctrader 4.3.11 there is a problem with this .

I make a macd that have macdline for that users

5.0
Đánh giá: 2
5
100 %
4
0 %
3
0 %
2
0 %
1
0 %
Đánh giá của khách hàng
August 12, 2025
Pros: Clear MACD visualization with extra signal line, customizable, stable. Cons: No alerts, no MTF mode, no auto-signal marking.
April 17, 2025
MACD指标写的比较有特色
Sản phẩm khác của tác giả này
IR Candle MTF
with this indicator you could see other time frame candle in your chart.
IR Macd on Chart
this indicator show macd on chart.
IR Moving Average
 this moving include everything that a trader needs from Moving Average.
IR Ichimoku Macd
this indicaotr show distance between Tenkan to Kijun, Close to Kijun and Close to Tenkan 
IR Slowing Moving
Add Slowing to IR Moving Average.
IR CheckList
you could put your check list in your chart you could split your test with “,” you could put your checklist in indicat
IR Moving MTF
multi time frame moving averge. you could choose different type of price like median ,high and ... and differnt type of
IR Multi Data
show symbol and time fram, daily net profit percent, daily net profit, and spread ln your chart. consider that timezone
IR VLine
don't move to the end of chart after timeframe changing. it should be better to use for near history. for long history
IR Close MTF
this indicator show other time frame close in lower time frame. for ex: show daily close in m 15.
IR Candle Open
IR Candle Open plots customizable opening price lines for daily, weekly, and monthly candles
IR Open Connector
This indicator connects the opening prices of higher timeframe candles (Daily, Weekly, Monthly, or
Bạn cũng có thể thích
Chỉ báo
Grid
NAS100
NZDUSD
+20
Trend Pullback Profile
Trend Pullback Profiler is a cTrader indicator built to analyze how a trend breathes by measuring the depth and frequenc
Chỉ báo
NAS100
XAUUSD
Breakout
+12
Daily Weekly Monthly - Highs & Lows
Daily/Weekly/Monthly - Highs & Lows Indicator (Customizable Settings)
Chỉ báo
RSI
Breakout
XAUUSD
+6
ZigZag
ZigZag filters noise, spots trends, patterns, pivots, aiding analysis, trade management, and confirmations. 📉📈
VegaXLR - Auto Support and Resistance
cTrader Auto Support & Resistance detects key levels with Fibonacci analysis and sends real-time trading alerts.
Chỉ báo
RSI
Breakout
XAUUSD
+5
Prime Trend Targets
PrimeTrend: ATR trendline detects reversals, plots entry/SL/3 targets. Tune params (speed vs. robustness). Backtest +
Ctrader Liniar Chart
Simple and efficient Indicator Designed to be profitable .With alarms for trend changes and support - resistance
Chỉ báo
RSI
Breakout
Signal
+1
ZScore
Z-Score measures price deviation from its average, helping identify extremes, trends, and trading opportunities ........
Chỉ báo
NAS100
XAUUSD
Breakout
+10
VWAPSigmaBandPRO_Max
Professional VWAP + Sigma Bands. Auto signals, 3 modes, live stats, multi-level entry/exit. Proven volume-based system.
Chỉ báo
NAS100
RSI
NZDUSD
+12
TrendMomentumScore
TrendMomentumScore_558: all-in-one EMA, MACD & RSI trend strength meter with clear -100 to +100 buy/sell zones.
Chỉ báo
Indices
XAUUSD
Prop
+8
FREE Squeeze Momentum from TradingView
Squeeze Momentum - Anticipate explosive market moves before they happen
Chỉ báo
RSI
Breakout
XAUUSD
+7
Candle Strength Oscillator
The Candle Pressure Index is a powerful, user-friendly indicator that reveals hidden market pressure inside candles.
ms_Candle_ColseTime
⏱ Candle Time Remaining – Real-Time Candle Countdown Indicator
IR Moving MTF
multi time frame moving averge. you could choose different type of price like median ,high and ... and differnt type of
Chỉ báo
NAS100
NZDUSD
XAUUSD
+12
rvwap v1
Rolling VWAP with dynamic or fixed time window, customizable source price and standard deviation bands.
Chỉ báo
NAS100
RSI
NZDUSD
+13
Stochastic RSI PRO
Unlock Stochastic RSI PRO in cTrader! Overlay RSI, highlight zones, and identify divergences with customizable settings.
Chỉ báo
RSI
Breakout
Supertrend
+3
Fibonacci Linear Regression Multi-timeframe
Combining Fibonacci levels and regression to analyze multidimensional market trends across multiple timeframes¡
Retro_Shooting_Game
trading stress-relief “mini-game”
Chỉ báo
Grid
NAS100
NZDUSD
+16
3D Normal Candles bY Mohammad KHR
3D candles for Normal OHLC candles.