
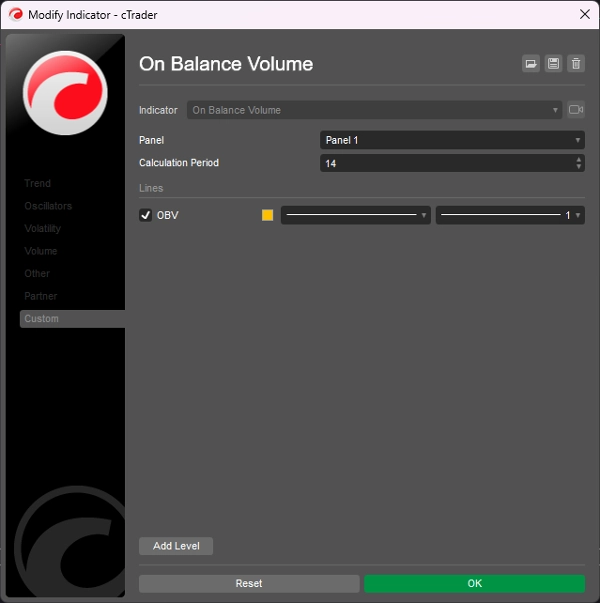
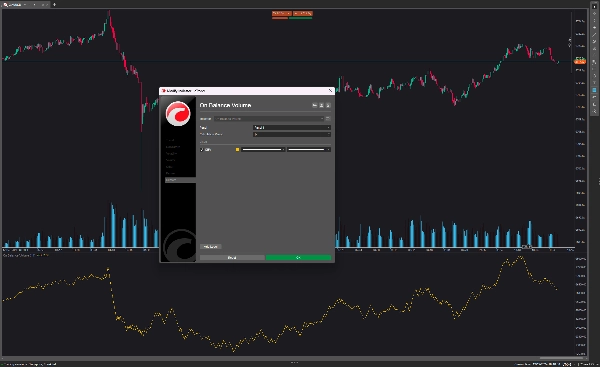
On Balance Volume
Chỉ báo
247 lượt tải
Phiên bản 1.0, Dec 2024
Windows, Mac
5.0
Đánh giá: 1
Mô tả
On Balance Volume (OBV) đo lường áp lực mua và bán như một chỉ báo tích lũy cộng dồn khối lượng vào những ngày tăng và trừ khối lượng vào những ngày giảm.
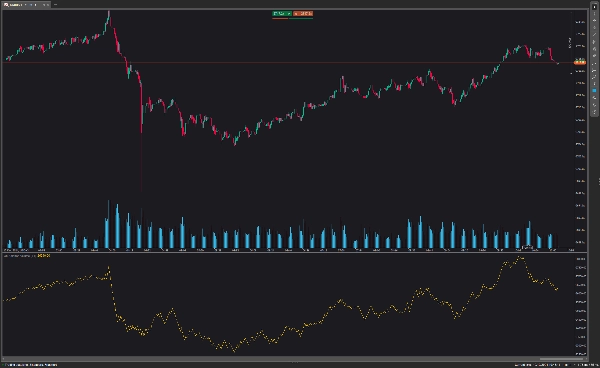
On Balance Volume được hiển thị ở dưới cùng của biểu đồ. Đường OBV tăng lên khi giá đóng cửa hôm nay tăng và giảm xuống khi giá đóng cửa ngày hôm qua cao hơn giá hiện tại.
Chỉ báo OBV thường xác định sự bứt phá trước khi đường giá làm điều đó và giúp thiết lập một xu hướng tăng rõ ràng. Nếu bạn muốn giao dịch với chiến lược này, bạn mở một vị thế forex tại mức giá bứt phá và đặt lệnh dừng lỗ trên đỉnh dao động cao gần đây.
Tóm tắt
Tóm tắt AI
On Balance Volume (OBV) is a technical indicator that measures buying and selling pressure by cumulatively adding volume on days when the closing price rises and subtracting volume on days when it falls. Displayed at the bottom of the chart, the OBV line moves upward when today's closing price exceeds the previous day's and moves downward when it is lower. This indicator is used to identify potential breakouts ahead of price movements and to confirm upward trends. Traders using OBV may open positions at breakout price levels and set stop losses above recent high swings. The indicator is applicable in forex markets and supports breakout trading strategies.
Hồ sơ chỉ báo
Đánh giá của khách hàng
5.0
Đánh giá: 1
5 | 100 % | |
4 | 0 % | |
3 | 0 % | |
2 | 0 % | |
1 | 0 % |
Đánh giá của khách hàng
August 18, 2025
Pros: A lightweight cumulative volume indicator that confirms price moves and detects divergences. Excellent for analyzing trend strength and sentiment. Cons: No alerts, tooltips, or template features. Signals may lag in volatile or manipulated markets.
Thảo luận
Câu hỏi thường gặp
Forex
Breakout
Các sản phẩm có sẵn trên cTrader Store, bao gồm bot giao dịch, chỉ báo và plugin, được cung cấp bởi các nhà phát triển bên thứ ba và chỉ nhằm mục đích cung cấp thông tin và tiếp cận kỹ thuật. cTrader Store không phải là nhà môi giới và không cung cấp lời khuyên đầu tư, khuyến nghị cá nhân hay bất kỳ đảm bảo nào về hiệu suất trong tương lai.
Sản phẩm khác của tác giả này


Giá
2
Lượt bán
6.9K
Cài đặt miễn phí