
KDJ
Индикатор
255 скачивания
Версия 1.0, Dec 2024
Windows, Mac
5.0
Отзывы: 1
Описание
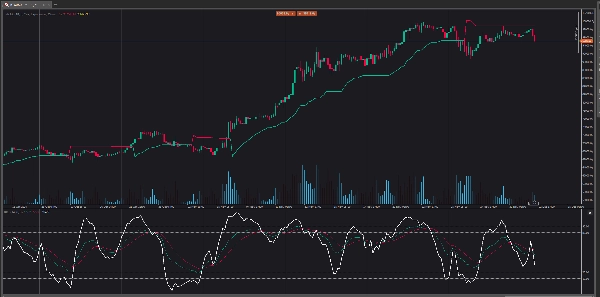
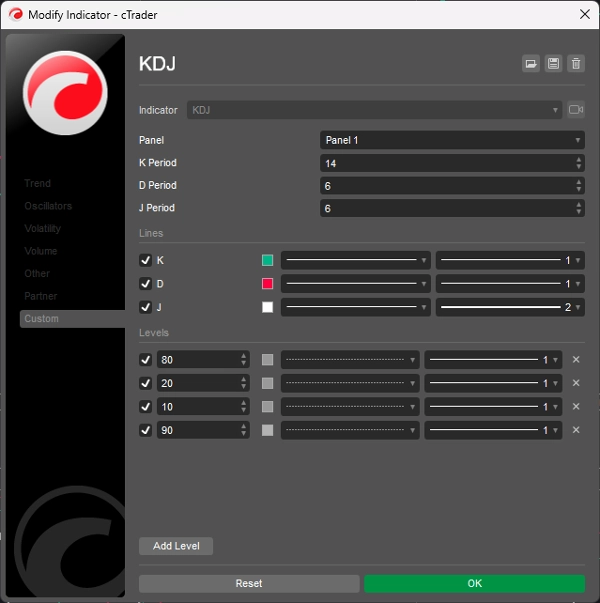
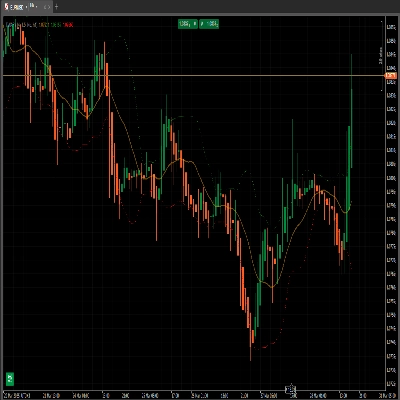
Отображение осциллятора KDJ состоит из 3 линий (K, D и J — отсюда и название отображения) и 2 уровней. Линии K и D совпадают с линиями стохастического осциллятора. Линия J представляет отклонение значения D от значения K. Сближение этих линий указывает на новые торговые возможности. Как и стохастический осциллятор, уровни перепроданности и перекупленности соответствуют моментам, когда тренд, вероятно, изменит направление.
Сводка
ИИ-сводка
The KDJ indicator is an oscillator consisting of three lines: K, D, and J, along with two reference levels. The K and D lines correspond to those used in the stochastic oscillator, while the J line measures the deviation of the D value from the K value. This convergence of the three lines is used to identify potential new trading opportunities. Similar to the stochastic oscillator, the KDJ indicator highlights overbought and oversold conditions, which often signal possible trend reversals. This tool is designed to assist traders in timing entries and exits by analyzing momentum and trend strength through these oscillating lines.
Профиль индикатора
Отзывы покупателей
5.0
Отзывы: 1
5 | 100 % | |
4 | 0 % | |
3 | 0 % | |
2 | 0 % | |
1 | 0 % |
Отзывы покупателей
August 18, 2025
Pros: Three-line stochastic oscillator (K, D, J) that identifies overbought/oversold levels and momentum shifts. Supports divergence analysis and crossovers between K and D as trading signals. Lightweight and responsive. Cons: No alerts, tooltips, or settings presets. J‑line can generate outlier v
Обсуждение
Частые вопросы
Продукты, доступные в cTrader Store, включая торговых ботов, индикаторы и плагины, предоставляются сторонними разработчиками и доступны исключительно в информационных и технических целях. cTrader Store не является брокером и не предоставляет инвестиционные консультации, персональные рекомендации или какие-либо гарантии будущей доходности.
Больше от этого автора


Цена
2
Продажи
6.9K
Бесплатные установки