
True Trend H4
Gösterge
2 satın almalar
Sürüm 1.0, Jun 2025
Windows, Mac
4.0
Değerlendirmeler: 1
Açıklama
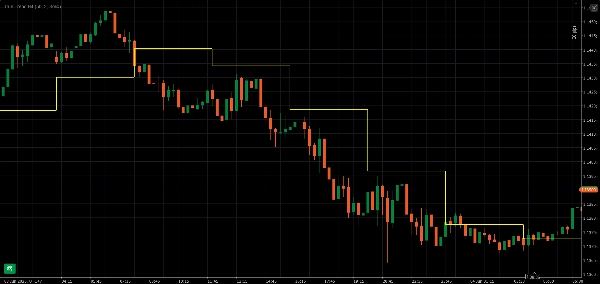
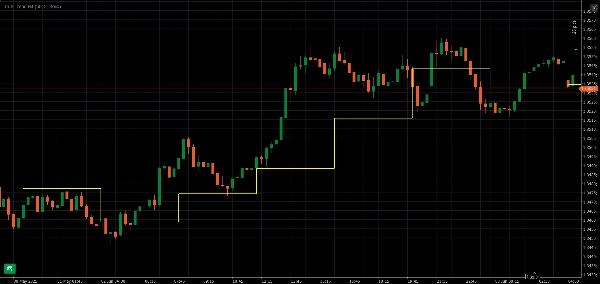
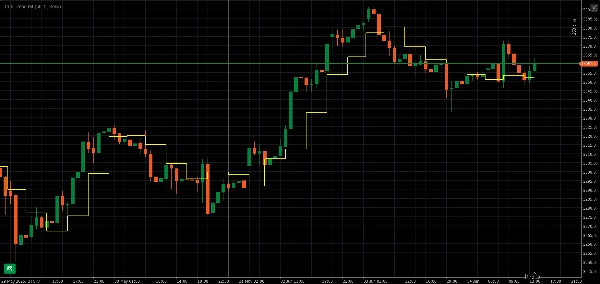
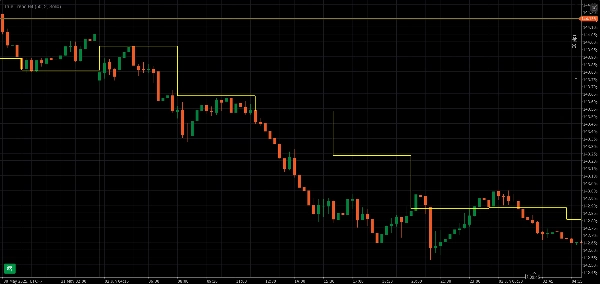
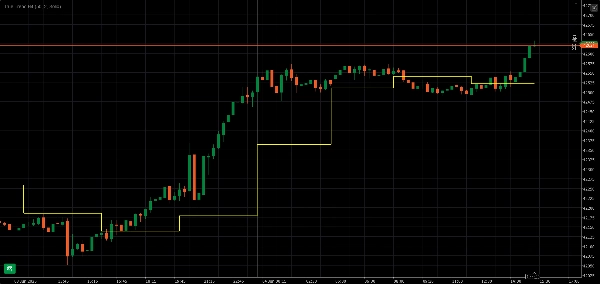
True Trend H4 göstergesi, H4 trend yönünü net bir şekilde göstermek için bir adım çizgisi kullanır. Bunu M1, M5, M15, M30 ve H1 gibi daha küçük zaman dilimlerinde çok iyi görebilirsiniz.
Özet
Gösterge profili
Müşteri değerlendirmeleri
4.0
Değerlendirmeler: 1
5 | 0 % | |
4 | 100 % | |
3 | 0 % | |
2 | 0 % | |
1 | 0 % |
Müşteri değerlendirmeleri
June 7, 2025
The signal still needs a chart check, no surprise there. A 5 minute check should not become a 30 minute rabbit hole.
Tartışma
SSS
cTrader Store üzerinden erişilebilen işlem botları, göstergeler ve eklentiler gibi ürünler, üçüncü taraf sağlayıcılar tarafından sağlanır ve yalnızca bilgilendirme ve teknik erişim amaçlarıyla sunulur. cTrader Store bir broker değildir ve yatırım tavsiyesi, kişisel öneriler vermez veya gelecekteki performansı garanti etmez.


Fiyat
Başlangıç 28/05/2025
69.61M
İşlem hacmi
391.92K
Kazanılan pip
2
Satışlar