
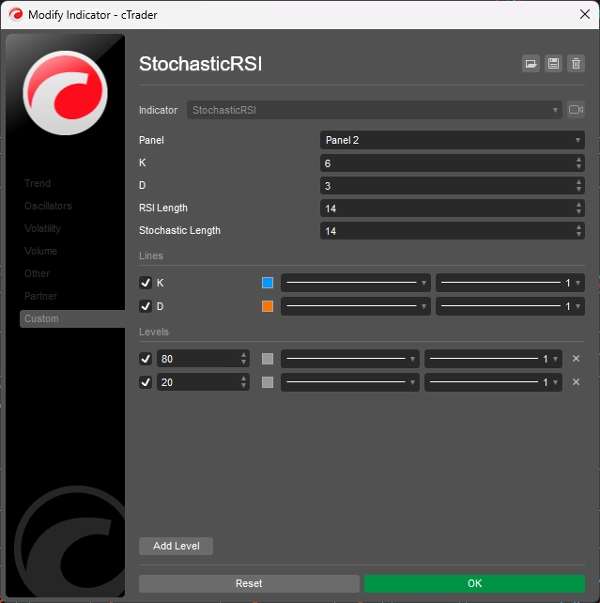
StochasticRSI
Chỉ báo
1.16K lượt tải
Phiên bản 1.0, Nov 2024
Windows, Mac
5.0
Đánh giá: 1
Mô tả
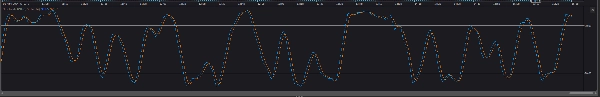
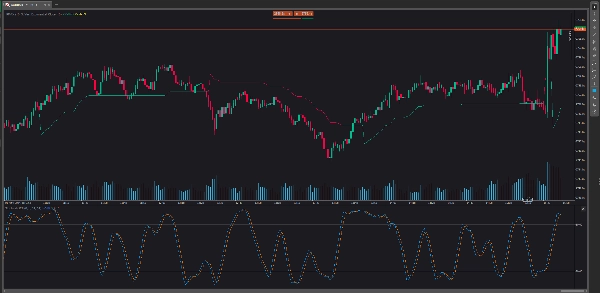
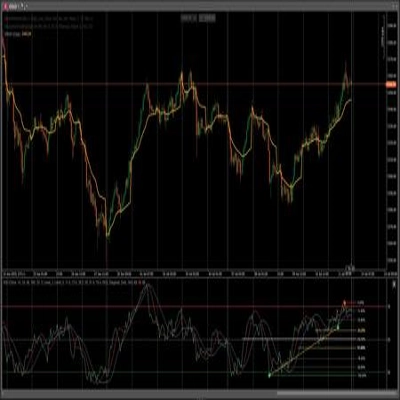
Stochastic RSI (StochRSI) là một chỉ báo phân tích kỹ thuật được sử dụng để hỗ trợ dự đoán thị trường chứng khoán bằng cách so sánh phạm vi giá của một chứng khoán với giá đóng cửa của nó. StochRSI độc đáo ở chỗ nó tập trung vào động lượng thị trường và rất tốt trong việc đọc các điều kiện thị trường mua quá mức và bán quá mức. StochRSI khác với các chỉ báo kỹ thuật khác, chẳng hạn như Chỉ số Sức mạnh Tương đối (RSI), vì nó di chuyển từ giá mua quá mức đến giá bán quá mức nhanh hơn RSI.
Tóm tắt
Tóm tắt AI
Stochastic RSI (StochRSI) is a technical analysis indicator designed to assess market momentum by comparing a security's price range to its closing price. It is used primarily to identify overbought and oversold conditions in stock markets, providing faster signals than the traditional Relative Strength Index (RSI). Unlike RSI, StochRSI moves more rapidly between overbought and oversold levels, making it useful for traders seeking timely momentum insights. This indicator supports analysis across various indices and is categorized under momentum indicators, specifically related to RSI.
Hồ sơ chỉ báo
Đánh giá của khách hàng
5.0
Đánh giá: 1
5 | 100 % | |
4 | 0 % | |
3 | 0 % | |
2 | 0 % | |
1 | 0 % |
Đánh giá của khách hàng
July 9, 2025
Pros: Combines Stochastic Oscillator and RSI for improved overbought/oversold detection. Easy to set up, stable on all timeframes. Cons: No tooltips or alerts. Requires confirmation from trend indicators to avoid false signals. Limited customization options.
Thảo luận
Câu hỏi thường gặp
Indices
RSI
Các sản phẩm có sẵn trên cTrader Store, bao gồm bot giao dịch, chỉ báo và plugin, được cung cấp bởi các nhà phát triển bên thứ ba và chỉ nhằm mục đích cung cấp thông tin và tiếp cận kỹ thuật. cTrader Store không phải là nhà môi giới và không cung cấp lời khuyên đầu tư, khuyến nghị cá nhân hay bất kỳ đảm bảo nào về hiệu suất trong tương lai.
Sản phẩm khác của tác giả này


Giá
2
Lượt bán
6.9K
Cài đặt miễn phí