
H Capital Liquidity Map Lite V1
مؤشر
324 التنزيلات
الإصدار 1.0، Mar 2026
Windows, Mac

منذ 09/03/2026
5.83M
حجم التداول
263.72K
الربح بالبيب
1
المبيعات
346
التثبيتات المجانية
الوصف
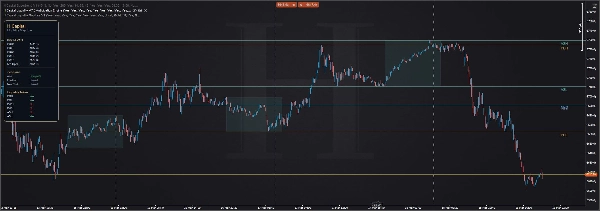
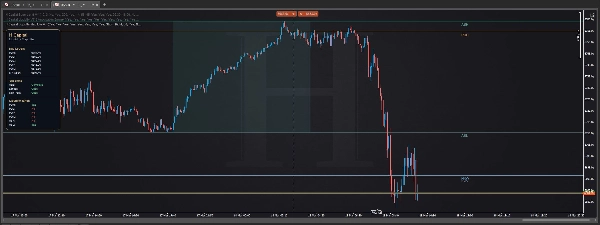
خريطة السيولة H Capital Lite هي أداة رسم بياني مجانية مصممة للمتداولين الذين يريدون هيكلًا بدون ازدحام.
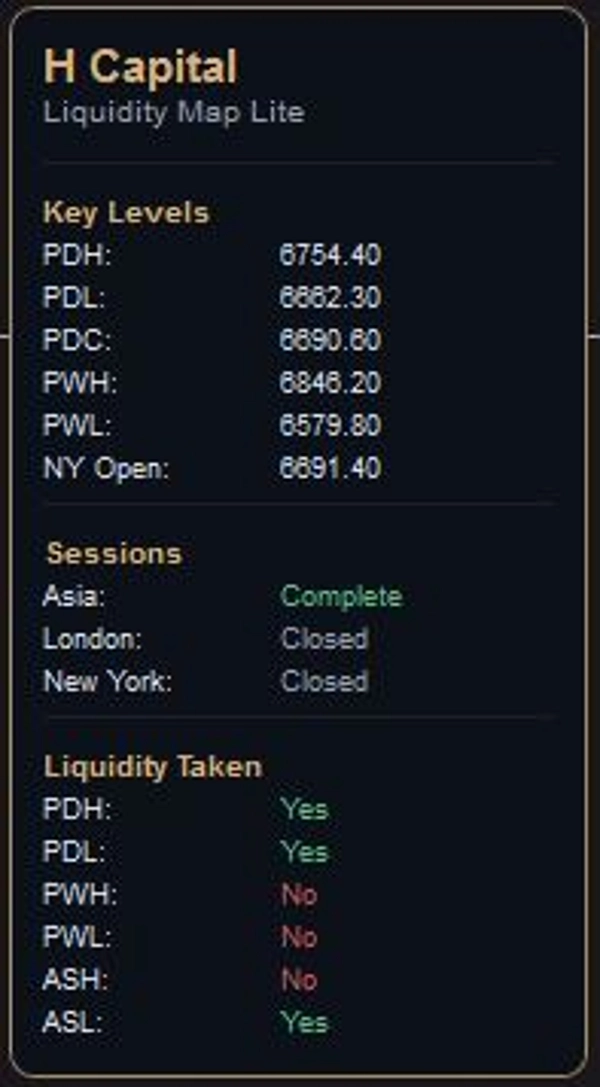
ترسم المراجع الرئيسية للسوق التي يراقبها العديد من المتداولين يوميًا:
- أعلى سعر لليوم السابق
- أدنى سعر لليوم السابق
- إغلاق اليوم السابق
- أعلى سعر للأسبوع السابق
- أدنى سعر للأسبوع السابق
- افتتاح نيويورك
- نطاق جلسة آسيا
- حالة السيولة المأخوذة
الهدف بسيط: إعطاء المتداولين إطارًا نظيفًا قبل التنفيذ.
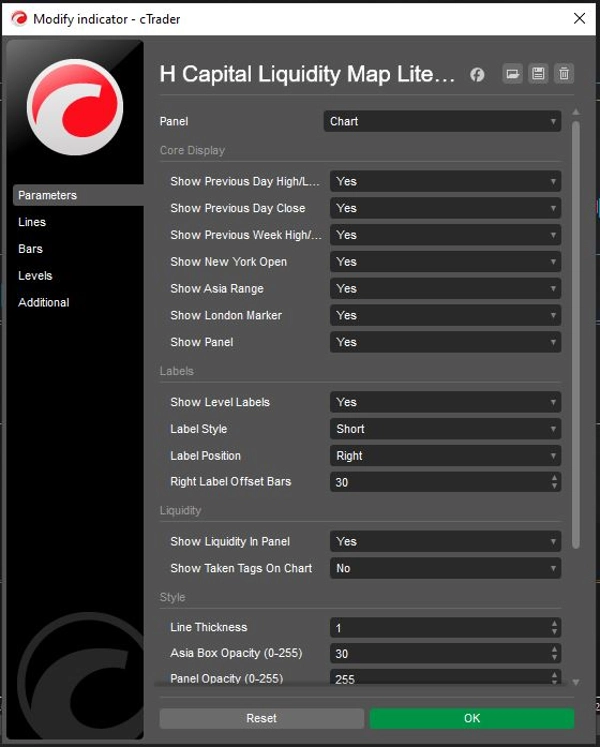
بدلاً من إغراق الرسم البياني بالإشارات، تركز خريطة السيولة H Capital Lite على المستويات ومراجع الجلسة التي تساعد في بناء السياق. تم تصميم الواجهة بأسلوب بسيط فاخر حتى يظل الرسم البياني قابلاً للقراءة بينما تظل المعلومات متاحة بنظرة سريعة.
الأفضل لـ:
- متداولي المؤشرات
- متداولي الفوركس
- متداولي المعادن
- المتداولين المعتمدين على السيولة
- المتداولين الذين يفضلون الرسوم البيانية النظيفة
ما يفعله:
- يرسم مستويات السيولة اليومية والأسبوعية الرئيسية
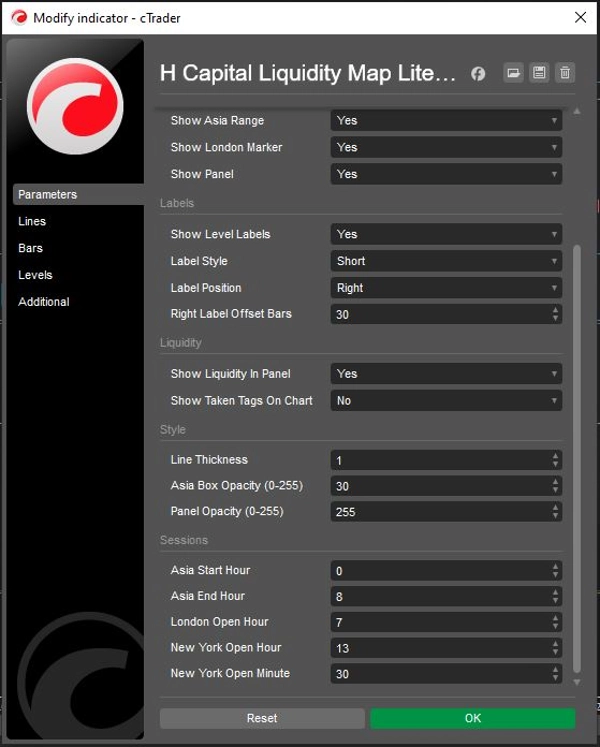
- يعرض هيكل الجلسة
- يتتبع ما إذا تم أخذ المستويات المهمة
- يحافظ على تنظيم المعلومات من خلال لوحة فاخرة على الرسم البياني
ما لا يفعله:
- لا يولد إشارات شراء/بيع
- لا يحل محل حكم التنفيذ
- لا يعمل كمحرك تنبيه
هذه ليست أداة إشارات. إنها خريطة سوق احترافية.
الملخص
ملخص الذكاء الاصطناعي
H Capital Liquidity Map Lite is a charting tool designed to provide traders with a clear, uncluttered view of key daily and weekly liquidity levels. It displays important market references such as the previous day’s high, low, and close; previous week’s high and low; New York open; Asia session range; and liquidity taken status. The tool organizes this information within a minimalist, premium on-chart panel to maintain readability and quick accessibility.
This indicator is suited for traders in indices, forex, metals, and those focusing on liquidity-based strategies who prefer clean chart layouts. It helps build market context by mapping session structures and tracking whether significant levels have been breached. The tool does not generate buy or sell signals, replace execution judgment, or function as an alert system. Instead, it serves as a professional market map to support informed trading decisions.
This indicator is suited for traders in indices, forex, metals, and those focusing on liquidity-based strategies who prefer clean chart layouts. It helps build market context by mapping session structures and tracking whether significant levels have been breached. The tool does not generate buy or sell signals, replace execution judgment, or function as an alert system. Instead, it serves as a professional market map to support informed trading decisions.
ملف تعريف المؤشر
مناقشة
تقييمات العملاء
0.0
التقييمات: 0
تقييمات العملاء
لا توجد تقييمات لهذا المنتج حتى الآن. هل جرَّبته بالفعل؟ كن أول من يخبر الآخرين!
الأسئلة الشائعة
Prop
Forex
Indices
Commodities
Crypto
Grid
يتم توفير المنتجات المتاحة من خلال cTrader Store، بما في ذلك روبوتات التداول والمؤشرات والإضافات، من قبل مطوري الطرف الثالث وإتاحتها لأغراض الوصول المعلوماتي والفني فقط. cTrader Store ليس وسيطًا ولا يقدم نصائح استثمارية أو توصيات شخصية أو أي ضمان للأداء المستقبلي.
المزيد من هذا المؤلف











السعر
منذ 09/03/2026
5.83M
حجم التداول
263.72K
الربح بالبيب
1
المبيعات
346
التثبيتات المجانية