present
Sign up and get $50 off your first purchase
Trading product for HCapitalFisherTransform Indicator Market Structure Supply & Demand, image 1
HCapitalFisherTransform
Indicator
9 downloads
Version 1.0, Aug 2026
Windows, Mac
Trading product for HCapitalFisherTransform Indicator Market Structure Supply & Demand, image 2
Trading product for HCapitalFisherTransform Indicator Market Structure Supply & Demand, image 3
Trading product for HCapitalFisherTransform Indicator Market Structure Supply & Demand, image 4
Since 09/03/2026
3.84M
Traded volume
259.74K
Pips won
1
Sales
321
Free installs

Description

H Capital Fisher Transform is a free cTrader implementation of the Fisher Transform developed by John F. Ehlers.

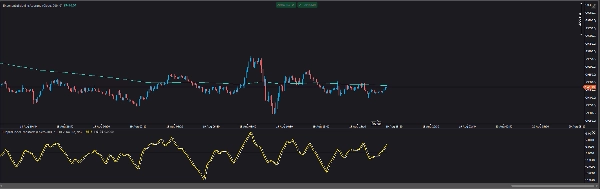
The indicator measures where price is positioned within its recent range, then applies the Fisher mathematical transformation to amplify values near the upper and lower extremes. This produces the sharp peaks and troughs for which the Fisher Transform is known and can make changes in short-term market direction easier to visualize.

This version was built with an emphasis on formula accuracy, transparency, and simplicity rather than adding unnecessary features or promising unrealistic trading results.

Included

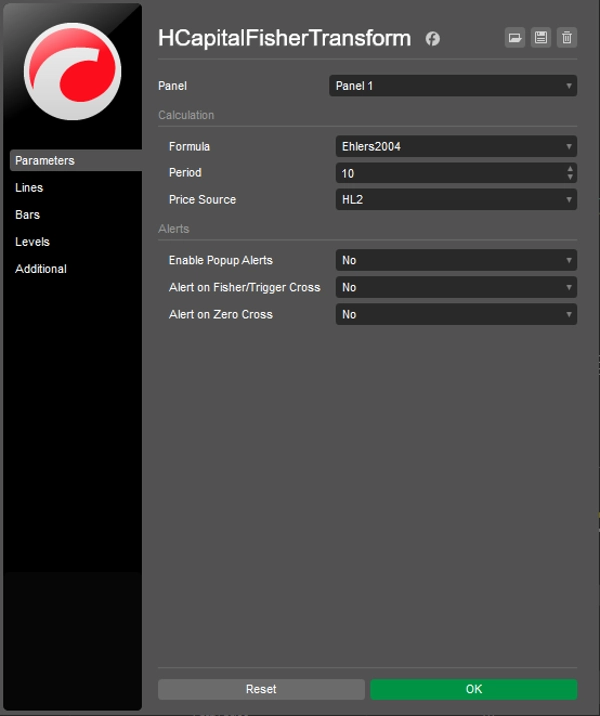
  • Ehlers 2004 Formula — the later formulation used as the default.
  • Ehlers 2002 Formula — the original published version available as an optional mode.
  • Adjustable lookback period.
  • Multiple price-source options.
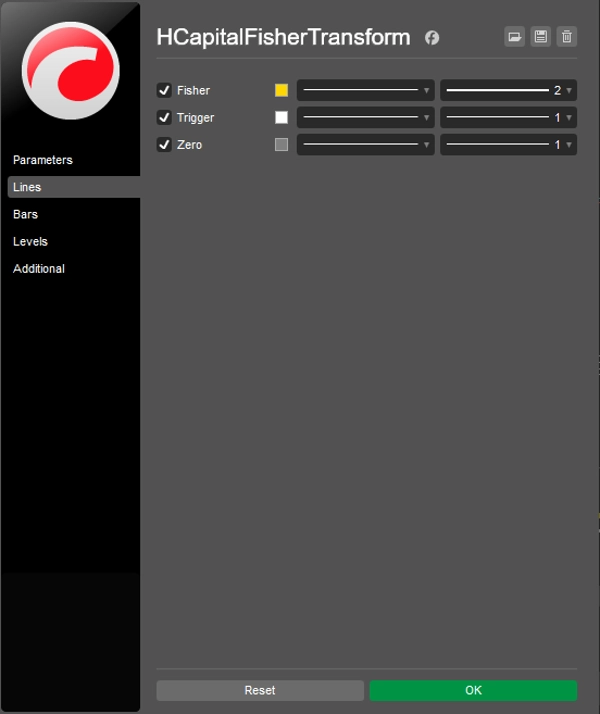
  • Fisher line.
  • Trigger line.
  • Zero reference line.
  • Optional Fisher/Trigger crossover alerts.
  • Optional zero-cross alerts.
  • Alerts based on confirmed closed bars.
  • Public output series for future cBot or indicator integration.
  • No future-bar calculations or look-ahead logic.

How to read it

A rising Fisher value indicates that price is moving toward the upper portion of its recent range.

A falling Fisher value indicates that price is moving toward the lower portion of its recent range.

The Trigger is the previous Fisher value. A crossover therefore highlights a change in the short-term direction of the Fisher line.

Large positive or negative readings show that price is near an extreme of its recent range. They should not automatically be interpreted as buy or sell signals.

A strong trend can keep Fisher at an extreme for an extended period, and the indicator can produce false turns during trending or choppy market conditions.

For that reason, Fisher is generally more useful as a market-analysis and confirmation tool than as a standalone trading system.

H Capital approach

This indicator is part of the H Capital project to research established trading indicators, understand the mathematics and evidence behind them, rebuild useful tools for cTrader, and make them freely available.

No claimed win rates.
No hidden logic.
No paywall.

Research it. Build it. Test it. Share it.

This indicator is provided for research and educational purposes and does not guarantee profitable trading results.

Summary

AI summary
H Capital Fisher Transform is a cTrader indicator implementing the Fisher Transform developed by John F. Ehlers. It measures price position within its recent range and applies a mathematical transformation to highlight sharp peaks and troughs, aiding visualization of short-term market direction changes. The indicator includes two calculation modes based on Ehlers' 2002 and 2004 formulas, with the 2004 version as default. Key features include an adjustable lookback period, multiple price-source options, Fisher line, trigger line (previous Fisher value), zero reference line, and optional alerts for Fisher/Trigger crossovers and zero-line crossings. Alerts are triggered only on confirmed closed bars. The indicator outputs public data series for integration with other cTrader bots or indicators and avoids future-bar or look-ahead calculations. Rising Fisher values indicate price moving toward the upper range, while falling values indicate movement toward the lower range. Crossovers between Fisher and trigger lines signal short-term directional changes. Large extreme readings reflect price near range limits but are not standalone buy or sell signals. This tool is intended primarily for market analysis and confirmation rather than as a sole trading system. It is part of the H Capital project focused on transparent, accurate, and simple implementations of established indicators for research and educational use.
Indicator profile
Indicator category
Momentum
Output type
Visualisation
Signals
Data requirements
Bars only
Supported signals
Trend strength

Customer reviews

0.0
Reviews: 0
Customer reviews
No reviews for this product yet. Already tried it? Be the first to tell others!

Discussion

FAQ

Market Structure
Supply & Demand
Liquidity Grab
Products available through cTrader Store, including trading bots, indicators and plugins, are provided by third-party developers and made available for informational and technical access purposes only. cTrader Store is not a broker and does not provide investment advice, personal recommendations or any guarantee of future performance.

More from this author

Indicator
Grid
Prop
+4
A free institutional-style chart tool that maps key daily liquidity levels in a clean H Capital interface.
cBot
Prop Firm Fit
One-click Trading
+3
Watches your equity in real time and blocks new trades the moment you're near your daily or max loss limit.

You may also like

Indicator
Forex
NAS100
+3
volumen perfile
Indicator
Volume
Key Levels
+1
Fixed-grid volume profile: bull and bear volume at every price level, with Point of Control and value area.
Indicator
Forex
Enhance your trading strategy with automated detection and alerts for key chart patterns.
Indicator
ATR
RSI
+11
This indicator puts three helpful trading tools on your chart at once. Think of it like having three expert traders
Indicator
ATR
RSI
+6
📊Zones Supply & Demand: Identifies key price levels with high volume concentration, marking Supply/Demand Zones & Marke
Indicator
AI
BOS
+4
Golden Boom and Crash Spike Detector is a trading tool designed for Crash 300 and Boom 300 indices on M1 Timeframe.
Indicator
Key Levels
Order Block
+5
Order blocks, fair value gaps, liquidity sweeps and a 24-timeframe signal scanner on one chart.
Indicator
Forex
Crypto
+3
Perfect Trend
Indicator
ICT ALL KİLL ZONES, LONDON , ASİA, NY AM, NY LUNCH, NY PM
Indicator
Key Levels
Order Block
+5
Pixel-perfect trading zones in a click! Instantly draw, resize & color via hotkeys. Automate your charting routine
Indicator
MACD
some user add moving average to macd to see better. in ctrader 4.3.11 there is a problem with this . I make a macd tha
Indicator
ATR
BOS
+5
Full ICT/SMC 4-step setup checker that alerts a long or short setup.
Indicator
AI
SMC
+5
Complete ICT Killzones: 5 sessions, easy colors, transparency controls & session info. Professional timing for cTrader.
Indicator
Smoothed CCI alerts! Audio & arrow signals for +/-100 crosses. Custom sounds & arrow filters. Precision trading!
Indicator
BOS
Key Levels
+1
Guided by Yahuah Yahusha. 15M: BOS above red (buys)/below green (sells). 4HC reject+BOS. 5M: RBS/SBR. SL wick. TP 1:4.
Indicator
cTreder Smart SMA
Indicator
Intrinsic Recursive Value Indicator
Indicator
RSI
XAUUSD
+2
Automatic ZigZag swings with dynamic support & resistance levels, labeling highs/lows for clear trend signals.

Price

Since 09/03/2026
3.84M
Traded volume
259.74K
Pips won
1
Sales
321
Free installs