الوصف
نظرة عامة
تم إنشاء مؤشر انفجار وضاح عطار (WAE) بواسطة أحمد وضاح عطار وتم تقديمه لمجتمع التداول في عام 2007. يجمع بين قياس زخم MACD وتحليل تقلبات نطاقات بولينجر لتحديد لحظات "انفجار السعر" — الفترات التي ينتقل فيها السعر من التماسك إلى حركة اتجاهية قوية.
يجيب المؤشر على سؤالين:
- هل يتزايد الزخم؟ (يقاس بمعدل تغير MACD)
- هل تتوسع التقلبات؟ (يقاس بعرض نطاقات بولينجر)
عندما تتوافق الشرطان فوق فلتر الضوضاء (المنطقة الميتة)، يشير ذلك إلى حركة انفجارية محتملة.
المكونات
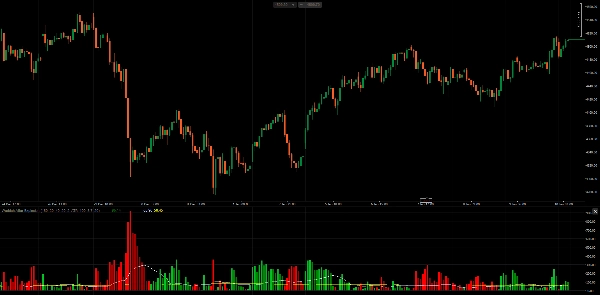
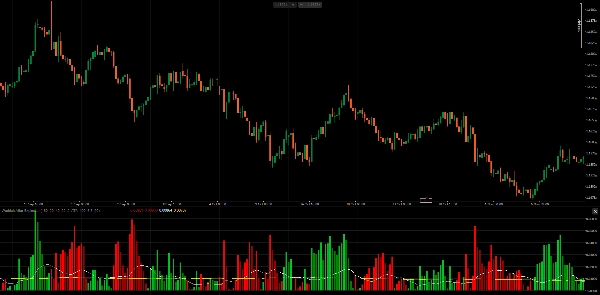
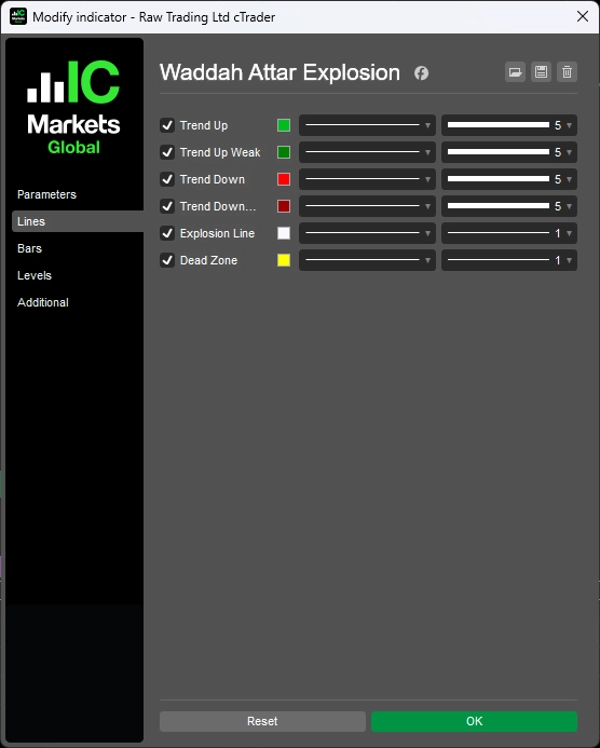
1. مخطط الاتجاه (أخضر/أحمر) يعرض معدل تغير خط MACD، مضروبًا في عامل الحساسية.
- الحساب:
(MACD_current - MACD_previous) × Sensitivity - الأشرطة الخضراء: زخم صعودي (تسارع MACD للأعلى)
- الأشرطة الحمراء: زخم هبوطي (تسارع MACD للأسفل)
- لون فاتح: زيادة الزخم مقارنة بالشريط السابق
- لون داكن: انخفاض الزخم مقارنة بالشريط السابق
2. خط الانفجار (أبيض) يمثل عرض نطاقات بولينجر، مشيرًا إلى توسع أو انكماش التقلبات.
- الحساب:
BB_Upper - BB_Lower - ارتفاع: توسع التقلبات (اختراق محتمل)
- انخفاض: انكماش التقلبات (تماسك)
3. المنطقة الميتة (أصفر) فلتر عتبة لإزالة الإشارات الضعيفة الناتجة عن ضوضاء السوق.
- مبني على ATR: يتكيف مع تقلبات السوق الحالية
- نقاط ثابتة: قيمة عتبة ثابتة
كيفية استخدام أحمد وضاح عطار له
وفقًا للمؤلف الأصلي:
قواعد الدخول للشراء يجب استيفاء جميع الشروط:
- المخطط الأخضر يرتفع
- المخطط الأخضر فوق خط الانفجار
- خط الانفجار يرتفع
- كل من المخطط الأخضر وخط الانفجار فوق المنطقة الميتة
قواعد الدخول للبيع يجب استيفاء جميع الشروط:
- المخطط الأحمر يرتفع
- المخطط الأحمر فوق خط الانفجار
- خط الانفجار يرتفع
- كل من المخطط الأحمر وخط الانفجار فوق المنطقة الميتة
قواعد الخروج
- الخروج من الشراء عندما يعبر المخطط الأخضر أسفل خط الانفجار
- الخروج من البيع عندما يعبر المخطط الأحمر أسفل خط الانفجار
رؤية رئيسية زاوية خط الانفجار مهمة. عندما يكون خط الانفجار مائلًا للأعلى ويكسر المخطط فوقه، فهذا يؤكد أن التقلبات تزداد بنشاط — "الانفجار" حقيقي، وليس إشارة خاطئة.
المعلمات
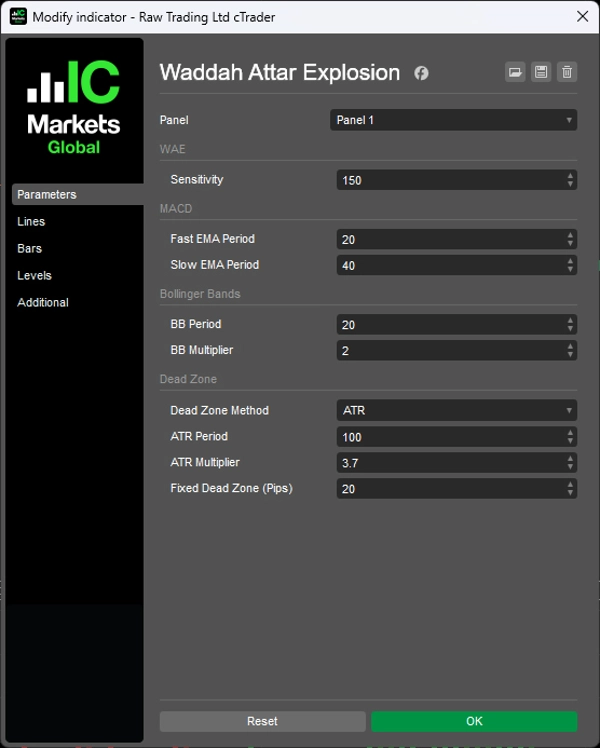
1. الحساسية
- الحساسية (150): مضاعف لمعدل تغير MACD
2. MACD
- فترة EMA السريعة (20): المتوسط المتحرك السريع لحساب MACD
- فترة EMA البطيئة (40): المتوسط المتحرك البطيء لحساب MACD
3. نطاقات بولينجر
- فترة BB (20): فترة النظر إلى الوراء لنطاقات بولينجر
- مضاعف BB (2.0): مضاعف الانحراف المعياري
4. المنطقة الميتة
- طريقة المنطقة الميتة (ATR): اختر بين الطريقة المبنية على ATR أو النقاط الثابتة
- فترة ATR (100): فترة حساب ATR
- مضاعف ATR (3.7): المضاعف المطبق على ATR للمنطقة الميتة
- المنطقة الميتة الثابتة (20): قيمة المنطقة الميتة بالنقاط (عند استخدام الطريقة الثابتة)
ملاحظات
- يعمل المؤشر على جميع الأطر الزمنية. أوصى المؤلف الأصلي باستخدام H1 و M30.
- يوصى باستخدام المنطقة الميتة المبنية على ATR لأنها تتكيف مع الأدوات المختلفة وظروف السوق.
- قد تحتاج معلمة الحساسية إلى تعديل بناءً على الإطار الزمني وتقلبات الأداة.
- يحدد هذا المؤشر توافق الزخم والتقلبات — لا يتنبأ بالاتجاه بمفرده. يُفضل استخدامه جنبًا إلى جنب مع تحليل الاتجاه أو مستويات الدعم/المقاومة.
__________________________________________________________________________________________
مزيد من المؤشرات المجانية
استكشف مجموعة واسعة من أدوات تحليل السوق — من الهيكل والحجم إلى الانحدار، والتقلب، والأطر الزمنية المخصصة.
الكود المصدري متاح على مستودع GitHub.
جميعها مجانية للاستخدام. ولكن إذا رغبت في دعم القهوة، يمكنك التبرع من هنا.
الدعم/المقاومة
الحجم
- محلل نشاط الحجم
- محلل كفاءة الحجم
- تحليلات ملف الحجم
- ملف الحجم - محدث
- تحليل انتشار الحجم
- VWAP (متوسط السعر المرجح بالحجم)
المتوسطات المتحركة
- قناة SSL
- المتوسط المتحرك المثبت
- المتوسط المتحرك بمقياس الانحراف
- مُفعّل جان العالي والمنخفض
- خط الاتجاه اللحظي
- متوسط كوفمان المتكيف مع رؤية الاتجاه
- قناة المتوسط المتحرك
- مجموعة المتوسطات المتحركة
- متوسط قناة الاتجاه
الأدوات/المخصصة
مبني على الانحدار
التقلب
المذبذبات
__________________________________________________________________________________________
إخلاء المسؤولية
التداول ينطوي على مخاطر. هذا المؤشر مخصص للتحليل الفني فقط — دائمًا طبق إدارة مخاطر مناسبة وتداول بمسؤولية.
التعليقات والتحسينات
إذا كانت لديك اقتراحات، طلبات ميزات، أو أفكار لتحسين، يرجى ترك تعليق في علامة التبويب النقاش. تساعد ملاحظاتك في تحسين المؤشر للجميع.