Açıklama
Bu gösterge, Günlük Açılış Çizgisini çizmek ve hemen etrafındaki yükseliş ve düşüş fiyat bölgelerini gölgelendirmek için tasarlanmış profesyonel bir araçtır. Tüccarların tahmin yürütmesini bırakmak yerine, günün ilk anından itibaren piyasa duyarlılığının net bir görsel haritasını sunar. Amacı: piyasanın günlük açılışın üzerinde mi yoksa altında mı işlem gördüğünü anında belirlemenize yardımcı olmak — bu, günlük içi stratejiler için önemli bir referans noktasıdır.
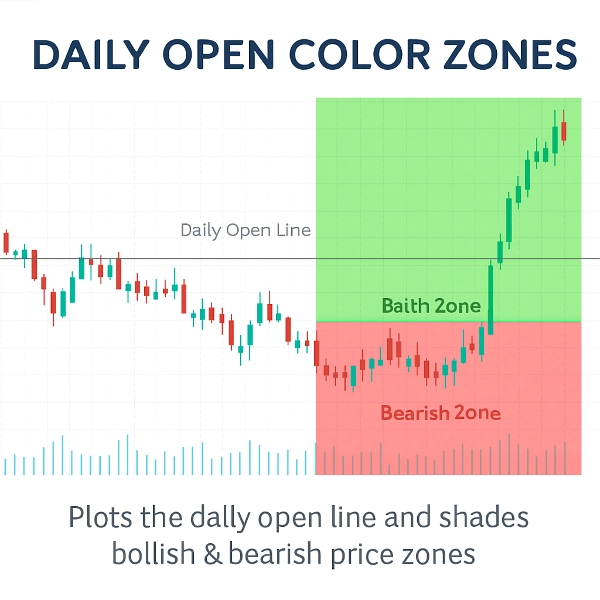
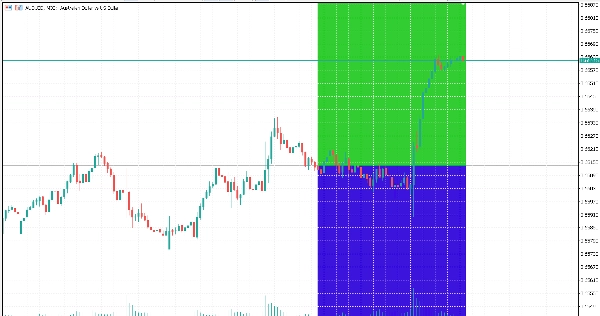
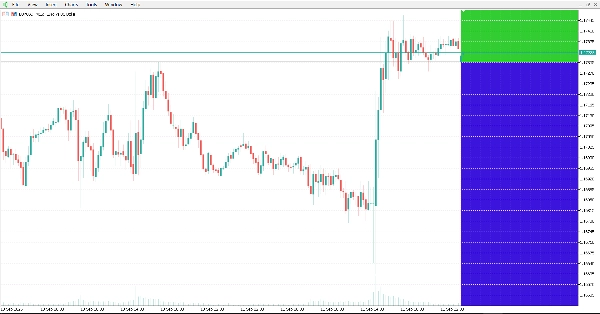
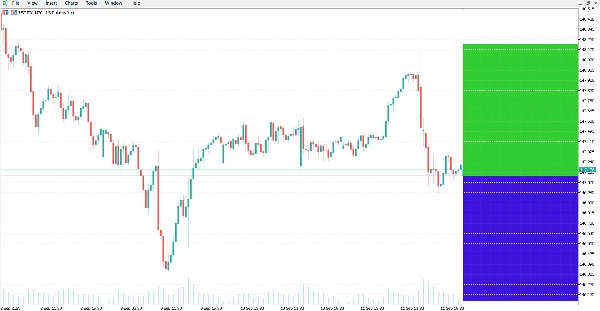
Gösterge, günlük açılış fiyatında otomatik olarak yatay bir çizgi çizer ve grafiği gölgelendirir:
Yükseliş bölgesi için çizginin üzerindeki Yeşil Bölge.
Düşüş bölgesi için çizginin altındaki Kırmızı Bölge.
Bu basit ama güçlü görsel ipucu, tüccarların eğilimi hızlıca değerlendirmesine, olası dönüşleri fark etmesine ve işlemleri mevcut piyasa yönüyle uyumlu hale getirmesine yardımcı olur.
Özellikler
Otomatik Günlük Açılış Çizgisi: Günlük açılış fiyatını hassasiyetle çizer.
Net Renk Bölgeleri: Özelleştirilebilir renkler ve şeffaflık ile yükseliş ve düşüş alanlarını anında ayırt edin.
Dinamik Güncellemeler: Bölgeler her yeni mum ve grafik yakınlaştırmasıyla otomatik olarak ayarlanır.
Özelleştirilebilir Görünüm: Çizgi stilini, kalınlığını ve bölge renklerini grafik temanızla uyacak şekilde değiştirin.
Hafif ve Hızlı: Büyük veri setlerine sahip canlı hesaplarda bile minimum CPU kullanımı için optimize edilmiştir.
Tüm Semboller ve Zaman Dilimlerinde Çalışır: Forex'ten emtialara, endekslere ve kriptoya kadar.
Neden Kullanmalı? Günlük açılış, profesyonel tüccarlar tarafından en çok izlenen fiyat seviyelerinden biridir. Yükseliş ve düşüş bölgelerini görsel olarak ayırarak, bu gösterge size piyasa duyarlılığı hakkında anında bilgi verir ve daha hızlı ve daha emin ticaret kararları almanıza yardımcı olur.
Sonuç Bu sadece grafiğinizde bir çizgi değil — görsel bir ticaret avantajıdır. İster scalping, ister günlük ticaret, ister swing ticareti yapın, Günlük Açılış Renk Bölgeleri göstergesi sizi günün en önemli fiyat seviyelerinden birine bağlı tutacaktır.


!["High-Low Divergence [Iridio Capital]" logosu](https://cdn.ctrader.com/image/webp/443c4661-7abb-40f1-842f-4b6ec560649b_40914)


