Deskripsi
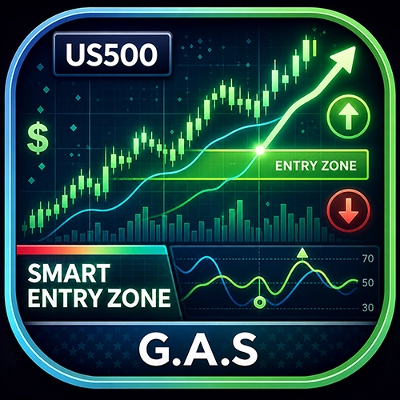
G.A.S - Smart Entry Zone adalah indikator aksi harga untuk US500 (S&P 500 CFD) yang membantu
pedagang mengidentifikasi titik masuk dengan probabilitas tinggi di sekitar zona harga yang ditentukan secara manual.
--- APA YANG DIANALISIS ---
Indikator memantau perilaku harga di sekitar dua level horizontal yang ditentukan pengguna -
batas atas dan bawah dari Smart Entry Zone. Ini melacak bagaimana harga mendekati,
menembus, dan bereaksi terhadap level-level ini secara bar per bar, mencari pola konfirmasi spesifik sebelum menghasilkan sinyal.
--- CARA MENGINTERPRETASI SINYAL DAN ELEMEN VISUAL ---
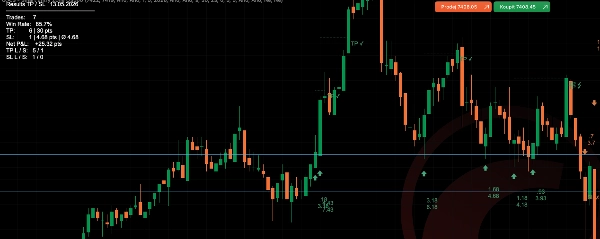
Garis zona menandai batas atas dan bawah zona masuk untuk hari perdagangan yang dipilih. Tiga jenis sinyal terdeteksi:
- Kasus A - Harga menyentuh zona dan kemudian menutup kembali di luar zona tersebut. Lilin lanjutan yang menutup ke arah breakout memicu sinyal. Satu sinyal per kejadian tembus (satu kali).
- Kasus B - Bar sebelumnya menutup di luar zona, bar saat ini menyentuh zona dan menutup kembali di luar. Mengonfirmasi pengujian ulang batas zona.
- Kasus C - Pada pembukaan jendela waktu sinyal yang tepat, harga sudah berada di luar zona. Lilin konfirmasi pertama ke arah tersebut memicu sinyal.
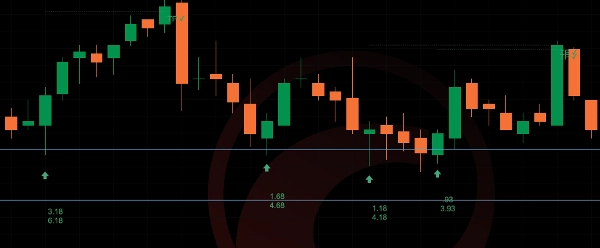
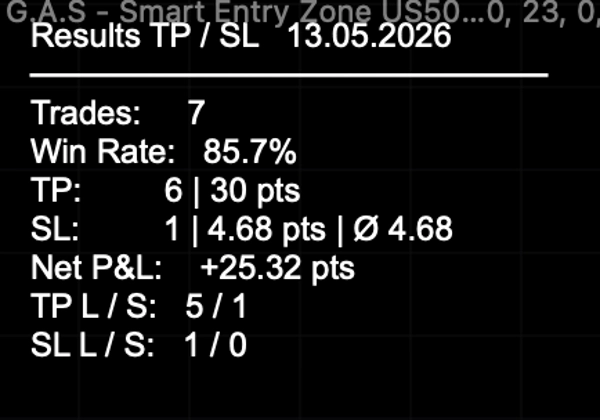
Sinyal ditampilkan sebagai panah di bawah (bullish) atau di atas (bearish) bar sinyal. Saat tampilan TP/SL diaktifkan, garis putus-putus menunjukkan level take profit dan stop loss dari bar masuk. Label TP atau SL menandai hasil saat level tercapai.
Label opsional SL Distance menunjukkan secara real time seberapa jauh harga saat ini dari batas zona stop loss.
--- PENGATURAN DAN PARAMETER UTAMA ---
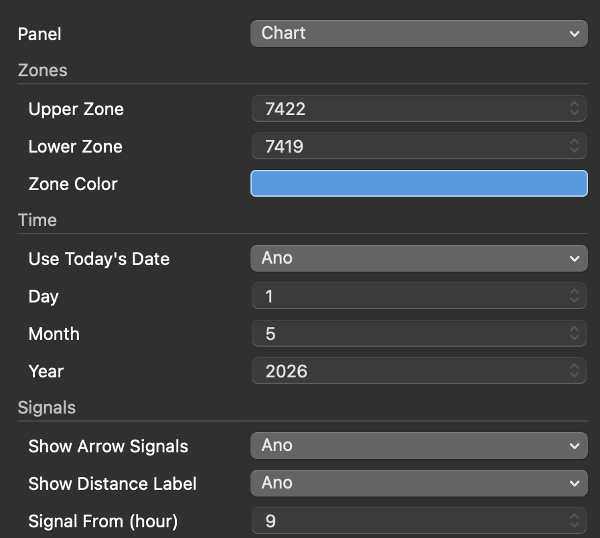
- Zona: level harga atas dan bawah, warna garis, tampilkan/sembunyikan
- Tanggal: gunakan tanggal hari ini secara otomatis atau atur tanggal tertentu secara manual
- Sinyal: aktifkan panah, konfigurasikan jendela waktu (misal 15:30 / 23:00), periode lookback tembus (berapa banyak bar setelah tembus sinyal tetap valid), label jarak aktif/nonaktif
- TP/SL: take profit dalam poin, tampilkan garis dan label, tabel hasil aktif/nonaktif, mode perdagangan tunggal (satu perdagangan terbuka sekaligus), warna kustom
- SL Distance: aktifkan label, warna kustom
--- KASUS PENGGUNAAN TIPIKAL DAN SKENARIO PERDAGANGAN ---
Indikator ini dirancang untuk perdagangan intraday US500 pada grafik 5 menit. Alur kerja tipikal adalah: sebelum pasar AS buka, pedagang mengatur level zona atas dan bawah untuk hari tersebut. Setelah jendela sinyal dibuka (default 15:30 Prague / 09:30 New York), indikator memantau setup Kasus A, B, atau C dan menandai entri yang valid dengan panah. Pelacak TP/SL secara otomatis mencatat hasil sepanjang sesi.
--- UNTUK SIAPA INDIKATOR INI PALING COCOK ---
Pedagang tingkat menengah hingga mahir yang sudah memiliki metodologi intraday yang terdefinisi dan menggunakan zona harga tetap sebagai bagian dari proses pengambilan keputusan mereka. Indikator ini tidak menghasilkan zona secara otomatis - pedagang harus mengidentifikasi dan memasukkan level secara manual setiap hari. Ini tidak cocok untuk pemula yang mencari sistem sinyal otomatis penuh.
--- BATASAN PENTING DAN CATATAN PENGGUNAAN ---
- Level zona harus dimasukkan secara manual setiap hari perdagangan - indikator tidak menghitungnya secara otomatis.
- Dirancang dan diuji untuk US500 pada grafik 5 menit. Perilaku pada instrumen atau kerangka waktu lain tidak dijamin.
- Statistik sinyal masa lalu yang ditampilkan di tabel hasil hanya untuk referensi dan tidak menjamin kinerja masa depan.
- Jendela waktu sinyal menggunakan waktu Prague (CET/CEST) secara internal. Sesuaikan pengaturan jam dari/ke jika broker Anda menggunakan waktu server yang berbeda.
Ringkasan
Signals appear as arrows indicating bullish or bearish entries, with optional automatic tracking and display of take profit (TP) and stop loss (SL) levels, including real-time SL distance labels. Users can customize zone levels, signal time windows, TP/SL parameters, and visual elements. The indicator logs trade statistics throughout the session for performance reference.
Intended for intermediate to advanced traders who incorporate fixed price zones into their intraday strategies, it requires manual input of zone levels daily and is specifically tailored for the US500 instrument. The indicator does not generate zones automatically and is not designed for other instruments or timeframes. Time settings use Prague time internally and should be adjusted if needed.