Description
📊 VPOC MONTE CARLO EXPECTED VALUE
https://chartshots.spotware.com/c/69c558e2c68df
Integrated Market Analysis: Volume Profile + Statistical Projection 🎯
🎯 WHAT IS IT?
VPOC Monte Carlo Expected Value is a quantitative analysis indicator that combines two professional trading methodologies:
- Market Depth Profile (VPOC) - Identifies where volume is truly concentrated 🏦
- Monte Carlo Simulation - Projects future scenarios based on statistical probabilities 📈
The result is an analysis system that tells you where the money is (Point of Control) and where it’s likely to go (projected Expected Value) 🧠
⚙️ HOW DOES IT WORK?
Module 1: Depth Profile (VPOC) 📊
The indicator analyzes the last 200 bars (configurable) and distributes volume across 30 price levels. It calculates:
- Point of Control (PoC): The price with the highest traded volume - represents market consensus where buyers and sellers were most active ⚖️
- Delta: Difference between buying vs selling pressure at each level 🔄
- Heatmap: Visualization of activity concentration 🔥
The logic: Price tends to revert toward the PoC because that’s where most pending liquidity resides. If price is far from the PoC, there’s a higher probability of return 🔄
Module 2: Statistical Projection (Monte Carlo) 🎲
Uses stochastic simulations (1,000 iterations by default) to project future price:
- Calculates the asset’s historical trend and annualized volatility 📉📈
- Generates random paths using a normal distribution (geometric Brownian motion model) 🌊
- Estimates Expected Value with standard deviation bands (±1 sigma) 📏
Formula applied: - Drift per bar = Annualized return / trading days 🧮
- Volatility per bar = Annualized volatility / √days ⚡
- Projection = Current price × e^(total drift + normal random × total volatility) 🔢
Module 3: Synergy 🔗
Combines both analyses to generate contextual signals:
Table
Signal Condition Meaning
BULLISH ↑ 🟢 Price > PoC + Positive projection Bullish trend confirmed by volume
BEARISH ↓ 🔴 Price < PoC + Negative projection Bearish trend confirmed by volume
OPPORTUNITY ★ 💡 Price < PoC + Positive projection Possible bounce from volume support
DIVERGENCE ⚠️ ⚠️ Price > PoC + Negative projection Warning of possible reversal
📈 WHAT IS IT USED FOR?
✅ Identify key volume levels - The PoC acts as a price magnet 🧲
✅ Estimate probabilities of success - Percentage of winning scenarios in the simulation 🏆
✅ Evaluate risk/reward - Projected Sharpe ratio and standard deviation 📊
✅ Confirm trade direction - Synergy between position relative to PoC and statistical momentum 🎯
✅ Target projection - Expected price levels for the defined hold period 🎯
🎮 CONFIGURATION AND USE
Main Parameters:
Table
Group Parameter Default Description
Depth Profile Analysis Period 200 bars History to calculate volume profile
Price Levels 30 Profile resolution (more levels = more detail) 🔍
Horizontal Offset 5 Profile position on the chart 📏
Statistical Projection Max Operation Duration 252 bars Time horizon of the projection ⏱️
Invested Capital $1,000 Base for monetary calculations 💰
Simulations 1,000 Number of random paths (more = more accurate, slower) 🔄
Risk-Free Rate 5% For Sharpe Ratio calculation 📉
Historical Strategy Use TP/SL No Activate to simulate with fixed targets 🎯
How to Interpret the Results Table:
plain
Copy
EXPECTED VALUE STATISTICS
┌──────────────┬─────────┬─────────┬─────────┬────────┐
│ Method │ $ Amount│ % Return│ Win Rate│ Sharpe │
├──────────────┼─────────┼─────────┼─────────┼────────┤
│ Historical │ -$19.56 │ -1.96% │ 47.2% │ -1.24 │
│ Simulation │ -$54.05 │ -5.40% │ 21.4% │ -4.95 │
└──────────────┴─────────┴─────────┴─────────┴────────┘
- Historical: Average performance of similar past trades 📜
- Simulation: Average result of the 1,000 Monte Carlo simulations 🎲
- Win Rate: Percentage of scenarios with positive outcome ✅
- Sharpe: Risk-adjusted return (greater than 1 is good, negative is bad) 📈
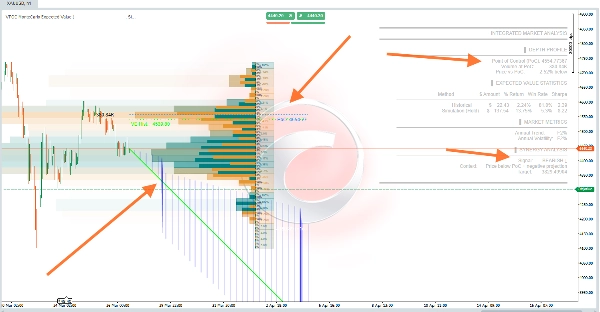
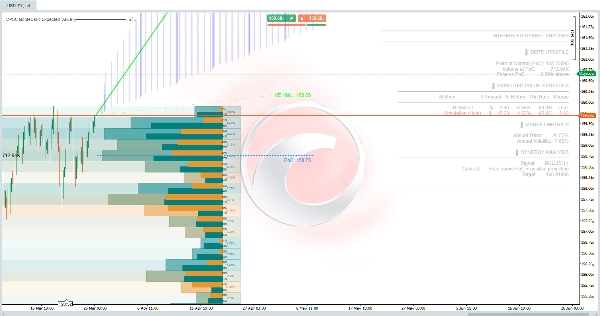
🖼️ Visual Elements on the Chart
Table
Element Color Meaning
Volume profile Orange/blue gradient Activity concentration by price level 🎨
PoC line Blue dotted Point of Control projected into the future 🔵
EV projection line Green/Magenta Expected price trajectory 🟢🔴
±1σ band White dotted lines 68% confidence range 📊
Historical EV line Green dotted Expected value based on historical data 🟢
Projection zone Translucent blue fill Probability area between bands 🔵
⚠️ IMPORTANT - Limitations
- Not a buy/sell signal - It’s a probabilistic analysis tool 🛠️
- Monte Carlo simulations assume historical distribution holds (does not predict black swan events) 🦢❌
- The PoC is dynamic - Recalculates on each new bar 🔄
- Requires sufficient history - Minimum 252 bars for reliable projections 📊
- Cryptocurrencies - The indicator automatically adjusts to 365 annual trading days vs 252 for traditional markets 🪙
💡 Recommended Usage Strategy
- Look for OPPORTUNITY ★ 💡 - Price below PoC but with positive projection (possible undervaluation)
- Confirm with Win Rate > 50% - Higher statistical probability of success ✅
- Avoid DIVERGENCE ⚠️ ⚠️ - Overvalued price relative to actual volume
- Use PoC as a reference - Stops or targets around this liquidity level 🎯
- Compare Historical vs Simulation - If they differ greatly, the market regime is changing 🔄
Summary
Using Monte Carlo simulations with default 1,000 iterations, it projects future price scenarios based on historical trends and volatility, applying a geometric Brownian motion model. This generates expected price trajectories with confidence bands (±1 standard deviation), estimating probabilities of success, risk-adjusted returns (Sharpe ratio), and potential target levels.
The combined analysis produces contextual signals such as Bullish, Bearish, Opportunity, and Divergence, based on price relation to PoC and projection direction. It supports various markets including Forex, stocks, commodities, indices, and cryptocurrencies, adjusting parameters like trading days accordingly.
Key configurable settings include analysis period, profile resolution, simulation count, and risk-free rate. Visual elements on the chart display volume profiles, PoC lines, expected value projections, and confidence intervals. The tool is designed for probabilistic market assessment and trade confirmation rather than direct buy/sell signals.