
Daily TPO profile
Indicator
214 downloads
Version 1.0, Nov 2025
Windows, Mac
Description
Daily TPO Profile
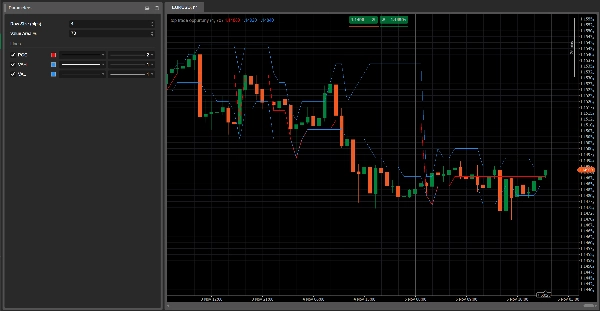
Daily TPO profile indicator that calculates POC, VAH and VAL for each session.
Plots the Point of Control and the 70% Value Area directly on the chart, helping you identify fair value zones, key support/resistance levels and potential areas of price rejection or acceptance.
How it works
This indicator builds a daily TPO (Time Price Opportunity) profile, similar to a Market Profile.
For each bar of the trading day, it:
- splits the price axis into fixed “steps” defined by “Row Size (pips)”
- for each price step, counts how many bars touched that level (TPO = how many times price traded there)
- at the end of the day it calculates:
- POC (Point of Control) → the price level with the highest number of TPOs (where the market spent the most time)
- VAH (Value Area High) and VAL (Value Area Low) → the price levels that contain approximately Value Area % (default 70%) of all TPOs for that session
The indicator plots three horizontal lines on the chart:
- Red line → POC
- Blue lines → VAH (upper) and VAL (lower)
These lines are updated bar by bar during the session and reset when a new trading day starts.
Main parameters
Row Size (pips)
Defines the thickness of each price step in the profile.- Smaller values = more detailed profile
- Larger values = smoother profile
Value Area %
Percentage of total TPOs contained inside the Value Area (typically 70%).
The Value Area is the price zone where most of the market activity occurred during the day.
How to read it
- POC (red line)
- The price level most “accepted” by the market during that day.
- Often acts as an equilibrium level: price may bounce, stall or strongly break around this zone.
- Value Area (VAH–VAL, blue lines)
- Represents the “fair value” zone where most trading took place.
- Price action relative to VAH/VAL can show:
- Rejection of extreme prices (fake breakouts beyond VAH/VAL)
- Acceptance of new prices (consolidation outside the Value Area)
Typical usage ideas
- Price rejects VAL and moves back inside the Value Area → potential long idea, betting on a return to “fair value” (mean reversion).
- Price breaks above VAH with strength and starts to build structure above → potential start of a new higher value area (trend-following scenario).
- Several days with POCs around the same level → strong equilibrium/accumulation zone, often key support/resistance.
Summary
AI summary
The Daily TPO Profile indicator constructs a daily Time Price Opportunity (TPO) profile similar to a Market Profile, analyzing market activity by price levels throughout each trading session. It divides the price axis into fixed increments ("Row Size" in pips) and counts how many bars traded at each price step, representing TPOs. At the end of the session, it calculates three key levels: the Point of Control (POC), where the market spent the most time; the Value Area High (VAH); and the Value Area Low (VAL), which together define the price range containing approximately 70% of the trading activity.
The indicator plots these levels as horizontal lines on the chart—POC in red, VAH and VAL in blue—updating them bar by bar during the session and resetting daily. Traders use the POC as an equilibrium price level that may act as support or resistance. The Value Area highlights fair value zones, with price action near VAH and VAL signaling potential rejection or acceptance of price extremes. Typical applications include identifying mean reversion opportunities when price rejects VAL or trend-following setups when price breaks above VAH.
Main adjustable parameters include Row Size (pips), controlling profile detail, and Value Area %, defining the percentage of TPOs included in the value area. The indicator supports analysis across various markets including forex, indices, commodities, stocks, and cryptocurrencies.
Indicator profile
Customer reviews
0.0
Reviews: 0
Customer reviews
No reviews for this product yet. Already tried it? Be the first to tell others!
Discussion
FAQ
Signal
Indices
Commodities
GBPUSD
RSI
Bollinger
Fibonacci
Scalping
AI
XAUUSD
NAS100
MACD
BTCUSD
Forex
Breakout
EURUSD
NZDUSD
Martingale
Prop
ZigZag
Supertrend
Fair Value Gap
SMC
Crypto
Grid
Stocks
ATR
USDJPY
VWAP
Products available through cTrader Store, including trading bots, indicators and plugins, are provided by third-party developers and made available for informational and technical access purposes only. cTrader Store is not a broker and does not provide investment advice, personal recommendations or any guarantee of future performance.


Price
42.11M
Traded volume
6.13M
Pips won
228
Sales
8.46K
Free installs