
Description
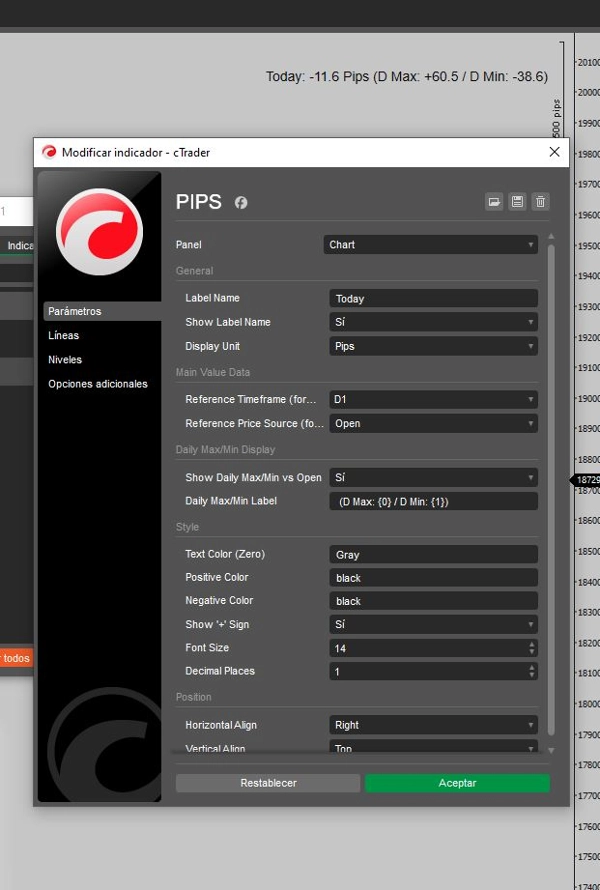
This script is designed for traders seeking real-time analysis of price action in relation to key daily levels. It calculates and displays the pip distance between the current price and the daily high, low, and open on your chart.
Key Features:
- Real-time Data: Provides the real-time pip distance from the current price to the daily high, low, and open.
- Visual Clarity: Offers a clean and minimalist display, eliminating unnecessary chart clutter.
- Versatility: Perfect for scalpers, day traders, and swing traders alike, enhancing decision-making at critical price levels.
- Efficient Performance: Lightweight and optimized for fast execution, ensuring seamless integration into your trading workflow.
Benefits:
- Informed Decisions: Quickly assess the market's positioning relative to key daily levels.
- Time-saving: Instant access to important price data without navigating through multiple tools.
- Customizable: Ideal for traders looking for a personalized, non-intrusive way to track price levels.
Summary
AI summary
Pips V4Final is a trading indicator that provides real-time analysis of price action relative to key daily levels. It calculates and displays the pip distance between the current price and the daily high, low, and open directly on the chart. The indicator features a clean, minimalist interface designed to reduce chart clutter, making it suitable for scalpers, day traders, and swing traders. It is lightweight and optimized for fast execution, allowing seamless integration into various trading workflows. Users can quickly assess market positioning at critical price points, saving time by accessing essential price data instantly. The tool is customizable, offering a non-intrusive way to monitor important daily price levels for informed decision-making.
Indicator profile
Customer reviews
4.5
Reviews: 2
5 | 50 % | |
4 | 50 % | |
3 | 0 % | |
2 | 0 % | |
1 | 0 % |
Discussion
FAQ
Products available through cTrader Store, including trading bots, indicators and plugins, are provided by third-party developers and made available for informational and technical access purposes only. cTrader Store is not a broker and does not provide investment advice, personal recommendations or any guarantee of future performance.
More from this author


Price
Since 13/01/2025
2
Sales