
说明
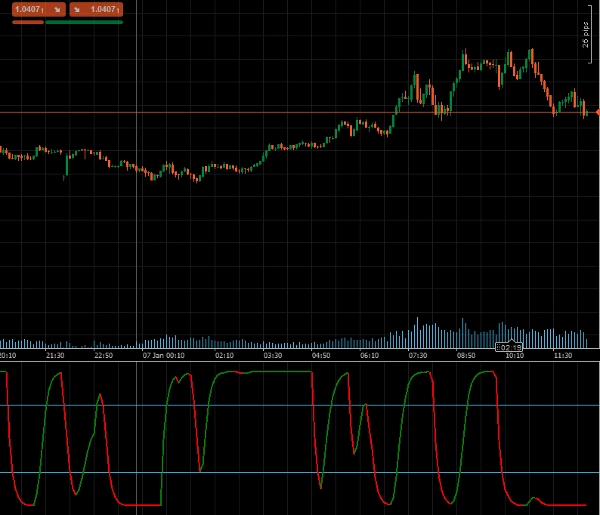
Schaff 趋势周期 (STC),由著名技术分析师 Doug Schaff 开发,是一种先进的交易指标,旨在以卓越的速度和精度识别市场趋势和反转。基于将趋势和周期成分结合的创新理念,STC 利用指数移动平均线 (EMA) 和随机计算,克服了如 MACD 或随机振荡器等滞后指标的局限性。这种独特的方法提供了更早、更可靠的交易信号,在趋势检测和市场分析中提供了显著优势。
主要特点:
- 早期趋势检测: 结合指数移动平均线 (EMA) 和随机计算,更快捕捉趋势。
- 可定制设置: 调整长度、快速移动平均线、慢速移动平均线、移动平均类型和平滑因子,以适应您的交易策略。
- 视觉警报: 动态颜色变化指示看涨或看跌趋势,便于解读市场状况。
- 支持超买/超卖水平: 内置水平(25 和 75)帮助识别潜在的市场转折点。
参数
- 长度: 定义趋势计算的周期数。
- 快速移动平均线长度: 设置快速移动平均线的长度。
- 慢速移动平均线长度: 指定慢速移动平均线的长度。
- 移动平均类型: 允许选择移动平均类型(例如,EMA、SMA)。
- 平滑因子: 调整平滑因子以优化趋势信号。
输出
- STC: 输出主要的 Schaff 趋势周期值,表示趋势方向和强度,供自动交易系统程序化使用。
- STCBull: 突出显示看涨趋势条件。
- STCBear: 突出显示看跌趋势条件。
摘要
指标配置
客户评价
5.0
评价:2
5 | 100 % | |
4 | 0 % | |
3 | 0 % | |
2 | 0 % | |
1 | 0 % |
客户评价
August 12, 2025
Pros: Fast and accurate trend detection, earlier signals than MACD, customizable levels. Cons: No alerts, no MTF mode, no trade statistics.
讨论
常见问答
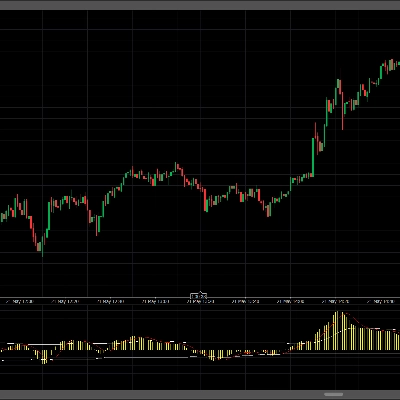
MACD
cTrader Store 提供的所有产品,包括交易机器人、指标和插件,均由第三方开发者提供,仅供信息参考和技术访问之用。cTrader Store 并非经纪商,不提供投资建议、个人推荐或任何未来业绩保证。
该作者的其他作品


猜您喜欢


价格
注册日期 24/09/2024
4.47K
免费安装