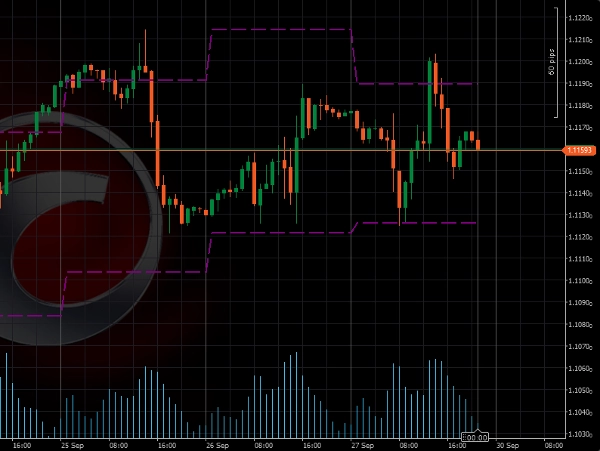
指标
Breakout
PDHL
"PDHL" 标识
3.0
03/09/2025
1564
Desktop
"PDHL" 已上传图片"PDHL" 已上传图片"PDHL" 已上传图片

Introducing the High-Low Trading Indicator

This indicator is designed to automatically plot the previous day's highest and lowest price levels on your chart. This tool helps you quickly identify key levels for potential breakouts and reversals.

Key Benefits:

  • Ideal for Breakout Trading: This indicator highlights critical price levels from the prior day, which are often used as reference points for breakout strategies. Trading breakouts above or below these levels can offer high-potential setups.
  • Simple Yet Effective: The High-Low Trading Indicator focuses on one of the most important aspects of price action – the previous day’s high and low. By incorporating these levels into your strategy, you gain a clearer sense of market structure and potential turning points.

Attentions:

  • Best used on timeframes less than 1 Day

Settings:

  • Include Sunday: default = no
3.0
评价:1
5
0 %
4
0 %
3
100 %
2
0 %
1
0 %
客户评价
July 9, 2025
Pros: Simple and clear display of previous day's high/low levels. Stable performance. Easy to use and customize. Cons: No breakout alerts. No visual zone fill option. Lacks additional filters or Fibo levels.
该作者的其他作品
DataWindow
An MT-style Data Window for enhanced data visualization – hope this will be helpful!
ColorfulTickVolume
Change the color of Tick Volume based on the price movement
cTraderStore
Instant access to the cTrader Store for discovering cBots, indicators, and plugins.
ColorfulTickVolumeV2
Changes the Tick Volume color based on price movement, synchronized with BullFillColor and BearFillColor in ColourOption
评分最高
"STC" 标识
5.0
(2)
免费
指标
MACD
STC
Schaff Trend Cycle (STC) Indicator
猜您喜欢
Volume Profile Triple Line - POC Median Mode
The Advanced Volume Profile Indicator calculates POC, Median, and Mode, revealing key price levels for smarter trading.
指标
XAUUSD
HP 2910
buy and sell
指标
Indices
Breakout
Prop
+7
NTNPICLL
NTNPICLL is a tool to check the best trading hours for the assets and also includes the highest and lowest point
DynamicVolumeSupplyDemand
Supply and Demand Zones
Candle Timer & Strength Demo
Candle Timer & Strength DEMO for cTrader This is a DEMO version of the Candle Timer & Strength indicator. You can use al
评分最高
免费
指标
Indices
RSI
Signal
Rsi + Volume
This indicator combines RSI (Relative Strength Index) with volume analysis to generate more reliable trading signals.
指标
Indices
Prop
Stocks
+6
New Way Sar - Pro
The Parabolic SAR, or "Stop and Reverse," is a dynamic technical analysis tool
指标
NAS100
NZDUSD
Breakout
+12
ATR Bands
Enhance trading with ATR Bands! Visualize market volatility using dynamic upper and lower ATR bands for precise decision
指标
NAS100
Indices
XAUUSD
+6
JacksonZones
Maps intraday and multiday structure using Fibonacci-projected session ranges.
指标
Indices
Prop
Stocks
+3
[Hamster-Coder] Price
Indicator designed to calculate and manipulate price inputs (sources) in real time
Trinity StochX
Indicator Stochastic With RSI
指标
RSI
Signal
MA-RSI HTF Confirmation
MA-RSI HTF Confirmation: Eliminate false signals and trade with confidence!
指标
RSI
Forex
Signal
+2
Rsi_custom
🔹 Advanced RSI with smart alerts and visual signals for faster trend reversal detection.
指标
Indices
Forex
Crypto
ICT Order Block
Order block
指标
Indices
Prop
Stocks
+3
4MA
This indicator consists of 3 moving averages that can be configured to your liking, from the type of moving average....
指标
ATR
Signal
Chandelier Flip Stop
An intelligent chandelier-style trailing stop that flips when price breaks the opposite stop.
指标
RSI
Breakout
XAUUSD
+1
ZigzagSR
Automatic ZigZag swings with dynamic support & resistance levels, labeling highs/lows for clear trend signals.
指标
VWAP
RSI
XAUUSD
+9
Turtle Soup ICT Strategy
Turtle Soup ICT Strategy – Detect liquidity traps & trade smart money moves with precision on cTrader.