
Mô tả
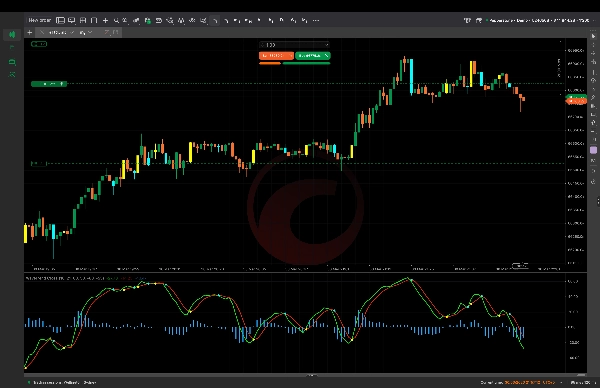
WaveTrend Cross là một chỉ báo động lượng mạnh mẽ, sạch sẽ và chính xác được thiết kế cho các nhà giao dịch muốn sự rõ ràng mà không phức tạp. Được xây dựng dựa trên logic WaveTrend đã được chứng minh, công cụ này giúp bạn xác định các cơ hội mua và bán có xác suất cao bằng cách sử dụng các chu kỳ thị trường mượt mà, tín hiệu giao cắt và sự thay đổi động lượng — tất cả trong một cái nhìn.
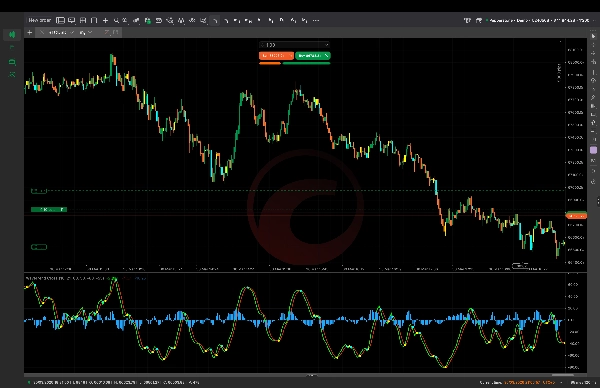
Không giống như các chỉ báo quá tải, WaveTrend Cross tập trung vào những gì thực sự hiệu quả trong điều kiện giao dịch thực tế. Các đường WT1 và WT2 theo dõi động lượng thị trường và tạo ra các tín hiệu giao cắt rõ ràng, trong khi biểu đồ thanh xác nhận trực quan sức mạnh và hướng đi. Sự kết hợp này cho phép các nhà giao dịch bắt được các điểm đảo chiều sớm và theo xu hướng với sự tự tin.
Tối ưu cho các thị trường di chuyển nhanh như Bitcoin, nó hoạt động xuất sắc trên các khung thời gian thấp như M1 và M5, làm cho nó lý tưởng cho các nhà giao dịch lướt sóng và giao dịch trong ngày. Dù bạn đang giao dịch tiền điện tử, forex hay chỉ số, chỉ báo này thích ứng mượt mà và cung cấp các tín hiệu nhất quán mà không có tiếng ồn không cần thiết.
Điểm nổi bật chính:
- Tín hiệu giao cắt mua/bán rõ ràng giúp quyết định dễ dàng
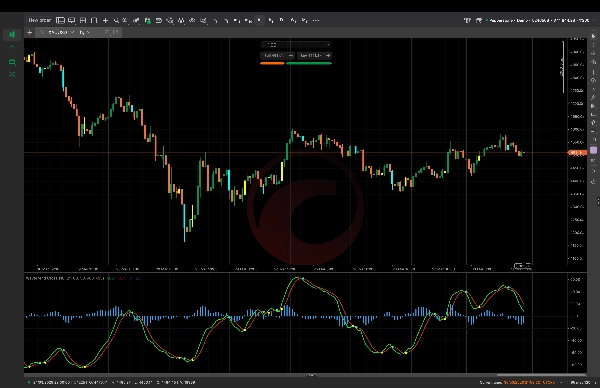
- Biểu đồ thanh động lượng để xác nhận sức mạnh xu hướng
- Vùng mua quá mức và bán quá mức để lọc các điểm vào rủi ro cao
- Nhẹ và nhanh — không trễ, không lộn xộn
- Hoàn hảo cho việc lướt sóng BTC và giao dịch trong ngày
WaveTrend Cross không chỉ là một chỉ báo — nó là một lợi thế giao dịch hoàn chỉnh khi kết hợp với quản lý rủi ro phù hợp và nhận thức xu hướng. Đơn giản, hiệu quả và được xây dựng cho lợi nhuận thực sự. 🚀📊
Tóm tắt
Đánh giá của khách hàng
5 | 0 % | |
4 | 100 % | |
3 | 0 % | |
2 | 0 % | |
1 | 0 % |


![Logo "[Hamster-Coder] Pivot Points MTF"](https://cdn.ctrader.com/image/webp/4c143e5a-309c-40e3-a578-f04d1e133ffa_31159)


