Mô tả
SmartFractalZigZag Plus — Smart Fractals, ZigZag, Auto Fibonacci và Vùng Hỗ Trợ/Kháng Cự Động
════════════════════════════════════════════════════════════════════════════════
TỔNG QUAN SẢN PHẨM
SmartFractalZigZag Plus cung cấp các vùng hỗ trợ/kháng cự định lượng với KDE, sự hội tụ HTF và bảng xu hướng SR Trend Bias, cùng với sự củng cố Fibonacci tự động bên trong các vùng S/R.
SmartFractalZigZag Plus là phiên bản cấp tổ chức của dòng SmartFractalZigZag dành cho cTrader.
Nó kết hợp động cơ fractal ổn định lịch sử, các dao động ZigZag rõ ràng và các mức Fibonacci tự động hoàn toàn từ Pro với động cơ Vùng Hỗ Trợ & Kháng Cự động, phát hiện hội tụ đa khung thời gian và bảng xu hướng Bull/Bear Trend Bias.
Bên trong, Plus được xây dựng như một mô hình S/R định lượng thay vì chỉ là một chỉ báo "đếm số lần chạm". Nó sử dụng ước lượng mật độ kernel trên các điểm xoay fractal hợp lệ về cấu trúc, khoảng cách chuẩn hóa ATR, tổng hợp bằng chứng trong không gian logit và suy giảm theo thời gian theo hàm mũ để biến hành động giá thô thành điểm sức mạnh giống xác suất ổn định cho mỗi vùng.
Plus được thiết kế cho các nhà giao dịch muốn thấy không chỉ nơi giá đã quay đầu, mà còn mức độ mạnh của từng vùng, cách nó phản ứng với các lần kiểm tra, và nơi cấu trúc khung thời gian cao hơn đang âm thầm củng cố biểu đồ hiện tại. Thiết kế dựa trên các ý tưởng từ SMC/ICT, Wyckoff, Lý thuyết Dow, lý thuyết Chan và giao dịch Fibonacci cổ điển, sau đó chắt lọc thành một động cơ duy nhất, mạch lạc.
════════════════════════════════════════════════════════════════════════════════
SO SÁNH TÍNH NĂNG (Pro vs Plus)
Cả Pro và Plus đều bao gồm:
• Phát hiện fractal thông minh & lọc theo cùng hướng
• Kết nối dao động ZigZag
• Fibonacci tự động thời gian thực
Tính năng chỉ có ở Plus:
• Vùng S/R động (bản đồ nhiệt mật độ KDE)
• Hội tụ S/R khung thời gian cao (HTF)
• Bảng xu hướng SR Trend Bias (chỉ số Bull/Bear + bảng điều khiển)
════════════════════════════════════════════════════════════════════════════════
TÍNH NĂNG CẤU TRÚC CHÍNH (Chia sẻ giữa các phiên bản)
────────────────────────────────────────────────────────────────────────────────
1. PHÁT HIỆN FRACTAL THÔNG MINH
Fractal là nền tảng của phân tích cấu trúc thị trường — chúng xác định các điểm cực giá cục bộ (đỉnh dao động và đáy dao động).
SmartFractalZigZag sử dụng động cơ fractal ổn định lịch sử với độ nhạy có thể điều chỉnh để bạn có thể thích nghi phát hiện cho scalping, giao dịch trong ngày, swing hoặc vị thế. Các tham số Left Bars và Right Bars cho phép bạn làm cho động cơ chọn lọc hơn hoặc ít hơn mà không thay đổi logic chiến lược tổng thể.
Cài đặt khuyến nghị theo phong cách giao dịch:
• Scalping: Left 3 / Right 2
• Intraday: Left 5 / Right 3
• Swing: Left 10 / Right 5
• Position: Left 20 / Right 10
────────────────────────────────────────────────────────────────────────────────
2. LỌC CÙNG HƯỚNG THÔNG MINH
Khi nhiều fractal liên tiếp xuất hiện cùng hướng, chỉ báo giữ lại điểm cực thật sự (đỉnh cao nhất cho fractal lên, đáy thấp nhất cho fractal xuống).
Điều này đảm bảo chuỗi Cao–Thấp–Cao–Thấp rõ ràng và giúp cấu trúc dễ đọc. Chỉ fractal gần nhất, bên phải nhất được phép điều chỉnh khi các thanh mới đóng; cấu trúc lịch sử không bị vẽ lại.
────────────────────────────────────────────────────────────────────────────────
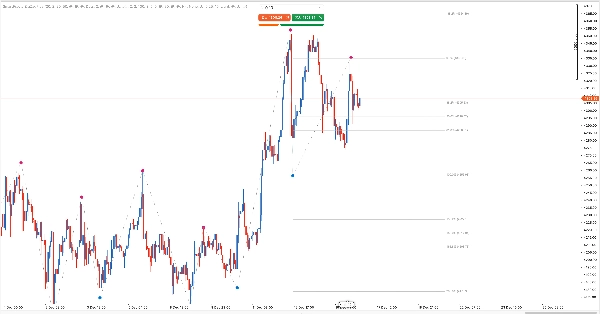
3. DAO ĐỘNG ZIGZAG
Các điểm fractal đã lọc được kết nối thành các dao động ZigZag, hiển thị rõ hướng xu hướng và giới hạn dao động chỉ trong nháy mắt.
────────────────────────────────────────────────────────────────────────────────
4. FIBONACCI TỰ ĐỘNG THỜI GIAN THỰC
Tự động vẽ các mức thoái lui và mở rộng Fibonacci dựa trên dao động gần nhất:
• Mỏ neo tự động – luôn kết nối với đỉnh/đáy cấu trúc đã xác nhận
• Cập nhật động – các mức điều chỉnh theo thời gian thực khi cấu trúc mới hình thành
• Bộ đầy đủ các mức thoái lui và mở rộng thường dùng (bao gồm mở rộng âm cho tiếp diễn xu hướng), tất cả có thể cấu hình riêng biệt
• Quy tắc trực quan rõ ràng: khi giá mức Fib rơi vào vùng S/R Plus, nhãn Fib được in đậm với tiền tố [SR] thay vì vẽ thêm hình dạng. Điều này giúp dễ dàng nhận biết "Fibonacci trong vùng S/R mạnh" mà không làm rối biểu đồ, và là một trong những nâng cấp chính so với phiên bản Pro.
────────────────────────────────────────────────────────────────────────────────
5. HỖ TRỢ GIAO DIỆN CHỦ ĐỀ
Hỗ trợ chủ đề sáng/tối tích hợp tự động phù hợp với nền biểu đồ. Tất cả các đường, vùng và nhãn được điều chỉnh để dễ đọc trong cả hai chủ đề.
════════════════════════════════════════════════════════════════════════════════
ĐỘNG CƠ S/R VÀ HỘI TỤ CHỈ CÓ Ở PLUS
────────────────────────────────────────────────────────────────────────────────
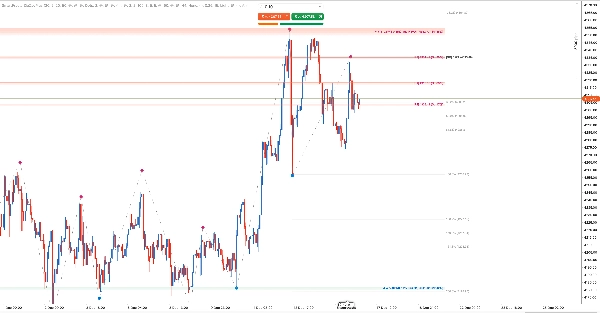
6. VÙNG S/R ĐỘNG (Bản đồ nhiệt mật độ KDE)
Plus giới thiệu một động cơ vùng Hỗ Trợ/Kháng Cự động đầy đủ dựa trên cấu trúc fractal:
• Các điểm xoay S/R dựa trên fractal – vùng được xây dựng từ các fractal S/R riêng biệt, độc lập với fractal hiển thị chính nhưng tuân theo cùng quy tắc ổn định lịch sử
• Cửa sổ cố định theo số fractal – bạn cấu hình một tham số Kích thước Cửa sổ Fractal duy nhất (ví dụ: 100). Động cơ luôn sử dụng N fractal S/R gần nhất, bất kể chúng trải dài bao nhiêu thanh
• Mật độ trọng số theo thời gian & dao động – mỗi fractal S/R đóng góp vào ước lượng mật độ kernel dựa trên tính mới, kích thước dao động và vị trí giá
• Băng thông tự động (không cần nhập thêm) – độ rộng vùng được suy ra từ khoảng cách fractal và ATR, giới hạn trong phạm vi ổn định
• Hiển thị bản đồ nhiệt – vùng được vẽ dưới dạng các hình chữ nhật đa lớp với độ mờ dựa trên mật độ, vùng mạnh xuất hiện dày và sáng hơn
• Giới hạn vùng tối đa mỗi bên – Vùng Kháng Cự Tối Đa và Vùng Hỗ Trợ Tối Đa giới hạn số vùng hiển thị, dùng xếp hạng sức mạnh làm bộ lọc tự nhiên
SỰ KHÁC BIỆT CỦA ĐỘNG CƠ S/R NÀY SO VỚI CÁC MỨC TRUYỀN THỐNG
Hầu hết công cụ hỗ trợ/kháng cự đều vẽ vài đường ngang thủ công dựa trên việc quan sát đỉnh/đáy, hoặc đếm số lần giá chạm mức giá đơn giản.
Plus áp dụng cách tiếp cận định lượng rất khác:
• Neo vào fractal, không tùy tiện – mỗi vùng được suy ra từ các điểm xoay fractal hợp lệ về cấu trúc thay vì các bóng nến đơn lẻ
• Vùng, không phải đường mỏng – KDE xây dựng các dải giá đầy đủ phản ánh nơi giao dịch thực sự tập trung, thay vì một tick chính xác
• Sức mạnh giống xác suất, không phải đếm số lần chạm thô – mỗi phản ứng được chuẩn hóa theo chiều cao dải và ATR, sau đó kết hợp theo thời gian thành EffectiveStrength
• Nhận thức vòng đời – các cú quét nhanh, phá vỡ sạch và kiểm tra lại lặp lại cách nhau được xử lý rất khác nhau; mức "bị phá và bỏ qua" sẽ suy giảm sức mạnh theo thời gian
• Ổn định trong lịch sử – khi vùng được hình thành và xác nhận, vị trí của nó ổn định; chỉ các phản ứng mới và bằng chứng HTF mới có thể cập nhật sức mạnh về sau (không vẽ lại phản ứng lịch sử)
Kết quả là một bản đồ S/R gần với cách các vùng cung/cầu được sử dụng trong tổ chức hơn là các chỉ báo "vẽ đường và đếm chạm" cổ điển.
────────────────────────────────────────────────────────────────────────────────
7. VÒNG ĐỜI VÙNG NHẬN THỨC PHẢN ỨNG
Không phải tất cả các lần chạm mức đều như nhau. Plus mô hình vòng đời của mỗi vùng S/R:
• Trạng thái – Hoạt động, Đang kiểm tra và Bị phá
• Loại kiểm tra – động cơ phân biệt phá vỡ sạch (vài lần đóng ngoài dải) với quét nghiêm ngặt (xuyên nhanh rồi quay lại nhanh với đảo chiều mạnh), cộng với kiểm tra lại không phá (chạm/bên trong và từ chối tiếp cận không chạm)
• Điểm phản ứng – với mỗi cửa sổ kiểm tra, hành động giá được đo theo cách chuẩn hóa (so với chiều cao dải và ATR) và chuyển thành ReactionScore ∈ [-1, 1] (trọng số cuối cửa sổ)
• Điểm kiểm tra – các lần kiểm tra thành công lặp lại, cách đều nhau tăng một chiều điểm kiểm tra riêng biệt
• Sức mạnh hiệu quả – cả ReactionScore và TestScore được kết hợp với sức mạnh cấu trúc cơ bản trong không gian logit để có EffectiveStrength ổn định cho mỗi vùng
Kết quả là một động cơ vùng có thể trả lời "Mức này đã giữ tốt thế nào trong quá khứ?", không chỉ "Giá đã chạm bao nhiêu lần?".
────────────────────────────────────────────────────────────────────────────────
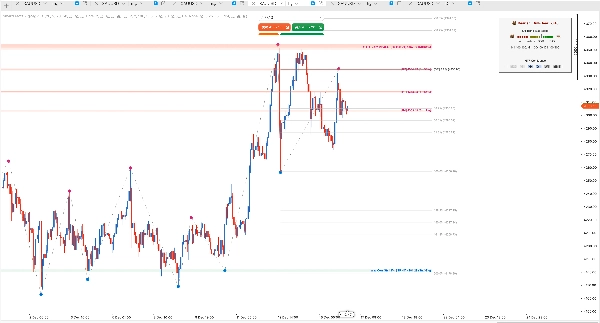
8. HỘI TỤ S/R ĐA KHUNG THỜI GIAN
Plus tự động tính toán vùng S/R trên các khung thời gian cao hơn (HTF) và chiếu ảnh hưởng của chúng lên biểu đồ hiện tại:
• Lên đến 3 lựa chọn HTF – chọn bất kỳ kết hợp nào trong M30, H1, H4, D1, W1, MN1 qua các nút bảng điều khiển tương tác
• Lưu giữ lựa chọn HTF – lựa chọn của bạn được giữ nguyên khi chuyển đổi khung thời gian trên cùng một cửa sổ biểu đồ
• Cấu hình HTF chính/phụ/ba (hoặc tự động ánh xạ dựa trên khung thời gian hiện tại)
• Xếp hạng khung thời gian vững chắc hoạt động với TF tiêu chuẩn và phi tiêu chuẩn (M2, H2, v.v.)
• Độ dung sai chồng lắp thích ứng dựa trên cả băng thông hiện tại và HTF
• Metadata hội tụ HTF lưu trữ theo vùng: HtfTag (ví dụ H4, H4+D1) và ConfluenceTFCount
• Tiền tố tam giác – với vùng có hội tụ HTF, văn bản nhãn bắt đầu bằng 1 đến 3 tam giác (▲/▼) chỉ số HTF hội tụ, cộng với nhãn sức mạnh đã hiệu chỉnh
Ví dụ: ▲▲ Corr Str 82% [S5 H4+D1] (Str:76%)
Nơi Corr Str 82% là sức mạnh đã hiệu chỉnh HTF, và Str:76% là EffectiveStrength thô của khung thời gian hiện tại.
────────────────────────────────────────────────────────────────────────────────
9. BẢNG XU HƯỚNG SR TREND BIAS (Chỉ số Bull/Bear)
Bảng xu hướng SR Trend Bias nhỏ gọn tóm tắt sức mạnh hỗ trợ so với kháng cự xung quanh giá hiện tại:
• Nút thu nhỏ/mở rộng – thu gọn bảng khi không cần; trạng thái được giữ qua các phiên
• Nút đặt lại HTF – khôi phục lựa chọn HTF về mặc định ánh xạ tự động dựa trên khung thời gian hiện tại
• Sử dụng EffectiveStrength của các vùng gần làm trọng số
• Xuất chỉ số thiên vị trong [-1, 1] ánh xạ tới nhãn trực quan như Cân bằng, Hơi tăng, Tăng, Tăng mạnh, Giảm mạnh, v.v.
• Thang đo trực quan với biểu tượng gấu/bò và các đoạn màu để đọc nhanh
• Rõ ràng chỉ ra khi dữ liệu không đủ (ví dụ chưa đủ fractal S/R hoặc không có đóng góp vùng hiệu quả)
• Nếu chỉ có hỗ trợ hoặc chỉ có kháng cự hiệu quả, chỉ số vẫn được tính (tự nhiên sẽ tiến gần +1 hoặc -1)
────────────────────────────────────────────────────────────────────────────────
10. TỰ ĐỘNG TẢI LỊCH SỬ BỔ SUNG & ỔN ĐỊNH
Để đảm bảo vùng S/R và hội tụ HTF có ý nghĩa, chỉ báo tự động quản lý tải lịch sử:
• Yêu cầu thêm lịch sử khi số fractal hiện tại/HTF thấp hơn Kích thước Cửa sổ Fractal
• Theo dõi trạng thái tải theo ký hiệu/TF với điều tiết và giảm tải để tránh quá tải nền tảng
• Xử lý sự kiện HistoryLoaded/Reloaded và xây dựng lại hoàn toàn trạng thái nội bộ khi thanh thay đổi
• Giữ bảng SR Bias đồng bộ với dữ liệu thực tế có sẵn cho mỗi khung thời gian
────────────────────────────────────────────────────────────────────────────────
11. BÊN TRONG: ĐỘNG CƠ ĐỊNH LƯỢNG
Động cơ S/R của Plus được thiết kế toán học nặng nhằm giữ đầu ra trực quan nhất quán trên các ký hiệu, khung thời gian và mức thu phóng:
• Ước lượng mật độ kernel (KDE) trên các điểm xoay fractal, với băng thông chuẩn hóa ATR, để tìm các cụm cung/cầu thật sự thay vì mức giá tùy ý
• Cơ sở chuẩn hóa cố định cho Str%, nên vùng "mạnh" có ý nghĩa giống nhau dù bạn phóng to hay thu nhỏ
• Hợp nhất bằng chứng trong không gian logit – BaseStrength, ReactionScore, TestScore và bằng chứng HTF được kết hợp bằng biến đổi logistic, không phải điểm số tùy ý. Điều này giữ thang sức mạnh mượt mà và có giới hạn
• Suy giảm theo thời gian theo hàm mũ và kiểm soát khoảng cách – các phản ứng cũ và các kiểm tra dày đặc tự động bị giảm trọng số theo công thức nửa đời
• Thiết kế ổn định lịch sử – khi dao động hoặc vùng được xác nhận, vị trí và Str% ổn định; chỉ bằng chứng mới nhất có thể làm nghiêng sức mạnh đã hiệu chỉnh
════════════════════════════════════════════════════════════════════════════════
DÀNH CHO AI?
• Nhà giao dịch trong ngày và swing muốn cấu trúc sạch, nhất quán lịch sử và bản đồ nhiệt S/R động
• Nhà giao dịch SMC/ICT quan tâm đến vùng OTE và lịch sử phản ứng mạnh hay yếu của vùng S/R xung quanh
• Nhà giao dịch tùy ý muốn Fibonacci tự động và ngữ cảnh S/R trên một màn hình duy nhất
• Nhà giao dịch đa khung thời gian phụ thuộc vào các mức khung thời gian cao hơn và muốn chúng được đánh dấu rõ trên biểu đồ đang hoạt động
════════════════════════════════════════════════════════════════════════════════
TẠI SAO CHỌN SMARTFRACTALZIGZAG PLUS?
Vấn đề: Các đường ngang cảm thấy tùy tiện và chủ quan
Giải pháp: Vùng được tạo từ thuật toán fractal nghiêm ngặt + mật độ KDE với quy tắc rõ ràng
Vấn đề: Không biết mức nào mạnh hay yếu
Giải pháp: Vòng đời nhận thức phản ứng và EffectiveStrength định lượng cả tầm quan trọng cấu trúc và cách giá hành xử quanh mức đó
Vấn đề: Mức HTF khó nhớ
Giải pháp: Hội tụ S/R HTF tự động và nhãn HtfTag + tiền tố tam giác rõ ràng trên mỗi nhãn vùng
Vấn đề: Quá nhiều công cụ riêng biệt làm rối biểu đồ
Giải pháp: Một chỉ báo kết hợp fractal + ZigZag + Fibonacci + S/R động + hội tụ HTF + bảng Bias
Vấn đề: Hành vi tải lại lịch sử không dự đoán được
Giải pháp: Quản lý tải lịch sử rõ ràng với phản hồi giao diện khi dữ liệu đang tải hoặc đã hết
════════════════════════════════════════════════════════════════════════════════
HOẠT ĐỘNG VỚI BẤT KỲ PHƯƠNG PHÁP NÀO
• SMC / ICT – BOS, CHoCH, điểm dao động, vùng OTE, S/R nhận thức phản ứng và quét thanh khoản
• Sóng Elliott – Điểm xoay dao động, mở rộng Fibonacci và hội tụ với vùng S/R động
• Lý thuyết Dow – Đỉnh cao hơn / đáy thấp hơn với dao động ZigZag rõ ràng
• Wyckoff – Vùng cung/cầu, lò xo, đẩy lên và chất lượng phản ứng của chúng
• Lý thuyết Chan – Bút, đoạn và căn chỉnh điểm xoay cấu trúc
• Fibonacci – Các mức vẽ tự động cùng nhãn hội tụ [SR] nhận thức vùng
════════════════════════════════════════════════════════════════════════════════
THAM SỐ (Điểm nổi bật của Plus)
Dưới đây là tổng quan cấp cao về các nhóm tham số quan trọng nhất. Để biết chi tiết kỹ thuật đầy đủ, vui lòng tham khảo tài liệu kèm theo.
────────────────────────────────────────────────────────────────────────────────
1. Cài đặt Fractal
• Left Bars – Số thanh bên trái để so sánh (mặc định: 20)
• Right Bars – Số thanh bên phải để xác nhận (mặc định: 2)
Hiển thị Fractal:
• Màu Fractal lên – mặc định: DeepPink
• Màu Fractal xuống – mặc định: DodgerBlue
• Kích thước Fractal – mặc định: 20
• Độ lệch Fractal (Điểm) – mặc định: 50
• Hiển thị Fractal – mặc định: BẬT
Cài đặt bộ lọc:
• Lọc liên tiếp – Lọc cùng hướng thông minh, cần cho ZigZag & Fibonacci (mặc định: BẬT)
────────────────────────────────────────────────────────────────────────────────
2. Cài đặt ZigZag
• Bật ZigZag – mặc định: BẬT
• Màu ZigZag – mặc định: Xám
• Kiểu ZigZag – mặc định: Chấm
• Độ dày ZigZag – mặc định: 2
────────────────────────────────────────────────────────────────────────────────
3. Cài đặt Fibonacci
• Bật Fibonacci – Công tắc chính (mặc định: BẬT)
• Hiển thị nhãn – Hiển thị nhãn giá (mặc định: BẬT)
• Công tắc mức – 19 công tắc riêng cho các mức từ -100% đến 200% (Mức cốt lõi mặc định BẬT)
Lưu ý: RightOffset được hiểu là phần trăm chiều rộng biểu đồ hiển thị hiện tại (khung nhìn) và được giới hạn trong phạm vi an toàn (1%-500%). Nó điều khiển cạnh phải chung của các đường/nhãn Fib và vùng/nhãn S/R.
────────────────────────────────────────────────────────────────────────────────
4. Cài đặt Vùng S/R (Plus)
• Bật Vùng S/R – Công tắc chính cho động cơ S/R động (mặc định: BẬT)
• Vùng xoay thanh trái – mặc định: 2
• Vùng xoay thanh phải – mặc định: 2
• Kích thước cửa sổ fractal – Số fractal S/R gần đây sử dụng (mặc định: 100)
• Tỷ lệ khoảng cách (ATR x) – mặc định: 5.0
• Vùng kháng cự tối đa – mặc định: 5
• Vùng hỗ trợ tối đa – mặc định: 5
• Hiển thị nhãn vùng – mặc định: BẬT
• Độ mờ tối đa % – mặc định: 90
• Màu kháng cự – mặc định: Tomato
• Màu hỗ trợ – mặc định: MediumSeaGreen
────────────────────────────────────────────────────────────────────────────────
5. Hội tụ S/R HTF
• Sử dụng hội tụ HTF – Bật hội tụ S/R đa khung thời gian (mặc định: BẬT)
• Ánh xạ HTF tự động – Chọn HTF tự động dựa trên TF hiện tại (mặc định: BẬT)
• HTF chính – mặc định: H4
• HTF phụ – mặc định: Không
• HTF ba – mặc định: Không
────────────────────────────────────────────────────────────────────────────────
6. Bảng xu hướng SR Trend Bias (Chỉ số Bull/Bear)
• Bật SR Trend Bias – mặc định: BẬT
• Ngưỡng thiên vị xu hướng – Ngưỡng thiên vị cho Cân bằng so với Bull/Bear (mặc định: 0.25)
────────────────────────────────────────────────────────────────────────────────
7. Cài đặt Hiển thị & Chủ đề
• Độ lệch phải (%) – % chiều rộng biểu đồ hiển thị dành cho bên phải (mặc định: 30)
• Chủ đề màu – Sáng / Tối (mặc định: Sáng)
• Sử dụng bảng màu chủ đề – mặc định: BẬT
────────────────────────────────────────────────────────────────────────────────
8. Cài đặt khác
• Buộc dọn dẹp tất cả các phiên bản – mặc định: TẮT
• Gỡ lỗi tải lịch sử – mặc định: TẮT
════════════════════════════════════════════════════════════════════════════════
LỘ TRÌNH NÂNG CẤP
Nếu bạn hiện đang sử dụng SmartFractalZigZag Pro và muốn:
• Vùng S/R động, nhận thức phản ứng với bản đồ nhiệt mật độ KDE
• Hội tụ S/R đa khung thời gian tự động và các tam giác trực quan rõ ràng
• Bảng xu hướng Bull/Bear tích hợp xây dựng từ sức mạnh S/R thực tế
thì SmartFractalZigZag Plus là bản nâng cấp tự nhiên — nó mở rộng cùng động cơ nền tảng thành quy trình làm việc đầy đủ về cấu trúc + toán học + S/R động + hội tụ HTF.
════════════════════════════════════════════════════════════════════════════════
LƯU Ý QUAN TRỌNG
LỊCH SỬ ỔN ĐỊNH THEO THIẾT KẾ
Chỉ báo được xây dựng để giữ các dao động và vùng S/R đã xác nhận ổn định trong lịch sử trong khi vẫn cho phép chân/vùng đang hoạt động phản ứng với hành động giá mới. Khi cấu trúc được xác nhận, các điểm neo của nó được khóa; chỉ chân đang hình thành và vùng mới nhất có thể thích nghi khi thị trường phát triển.
PHỤ THUỘC CHUYỂN ĐỔI
ZigZag và Fibonacci đều yêu cầu Lọc liên tiếp = BẬT. Nếu bạn tắt, chỉ các điểm fractal thô được hiển thị và ZigZag/Fibonacci bị vô hiệu hóa. Vùng S/R luôn sử dụng động cơ fractal riêng với lọc cùng hướng được áp dụng.
ĐỦ DỮ LIỆU
Vùng S/R và hội tụ HTF yêu cầu ít nhất số fractal S/R theo Kích thước Cửa sổ Fractal trên khung thời gian hiện tại và HTF đã chọn. Khi dữ liệu đang tải hoặc không đủ, bảng Bias sẽ rõ ràng chỉ ra trạng thái này.
DÙNG THỬ
Có thể có thời gian dùng thử qua cTrader Store để bạn kiểm tra chỉ báo trên các ký hiệu và khung thời gian của riêng bạn trước khi mua.
════════════════════════════════════════════════════════════════════════════════
HỖ TRỢ
Nếu bạn có bất kỳ câu hỏi hoặc phản hồi nào, vui lòng liên hệ với chúng tôi qua cTrader Store.
Cảm ơn bạn đã chọn SmartFractalZigZag Plus!