
Mô tả
🌟 MA Quant Volume Profile V2.0 Phiên bản Tương lai
Công cụ Phân tích Thị trường Đột phá dành cho Nhà giao dịch Chuyên nghiệp
🚀 MỚI TRONG V2.0 - PHIÊN BẢN TƯƠNG LAI
Giao diện Đột phá
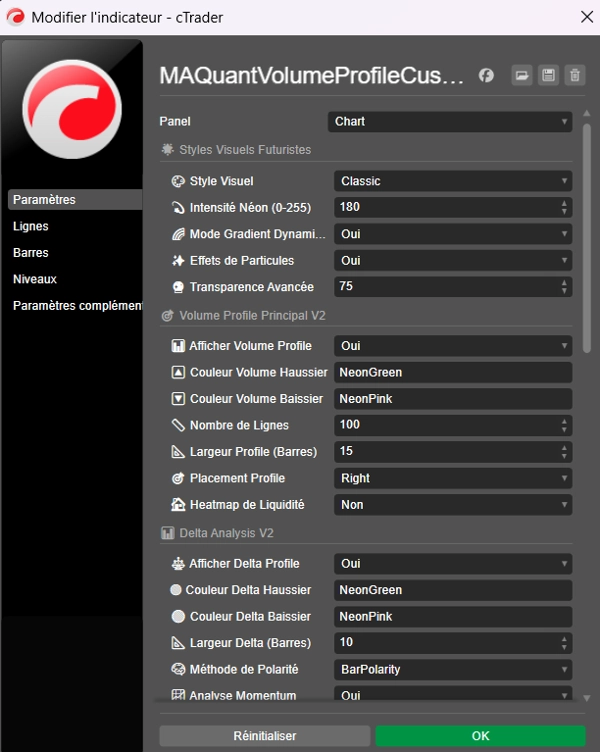
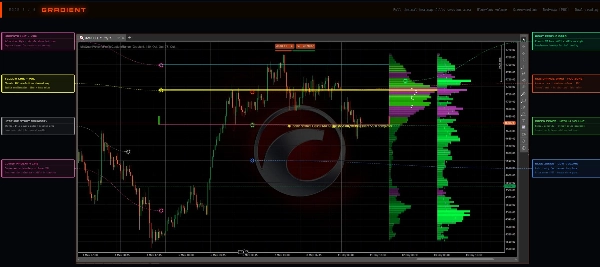
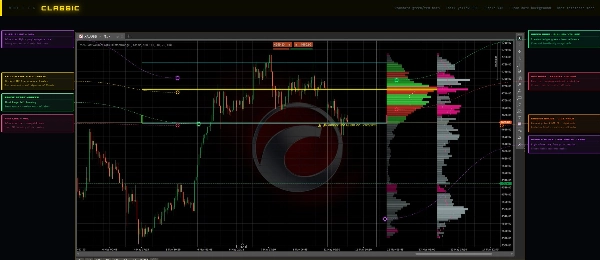
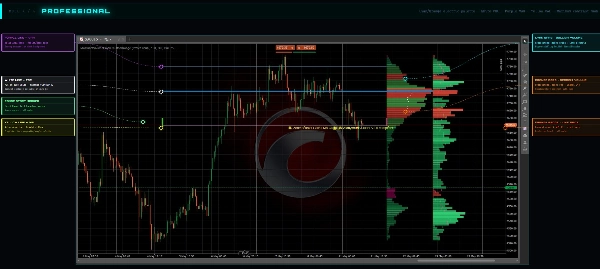
- 🎨 5 Phong cách Hình ảnh Tương lai: Tương lai, Neon, Chuyên nghiệp, Gradient, Cổ điển
- ⚡ Hiệu ứng Neon Động: Cường độ điều chỉnh được (50-255) với độ trong suốt nâng cao
- 🌈 Gradient Hoạt hình: Chuyển đổi mượt mà và màu sắc cyberpunk
- ✨ Hiệu ứng Hạt: Trực quan hóa khối lượng lớn với hoạt ảnh
- 🔮 Giao diện Holographic: Bảng điều khiển thông minh theo thời gian thực
Phân tích Tổ chức Tiên tiến
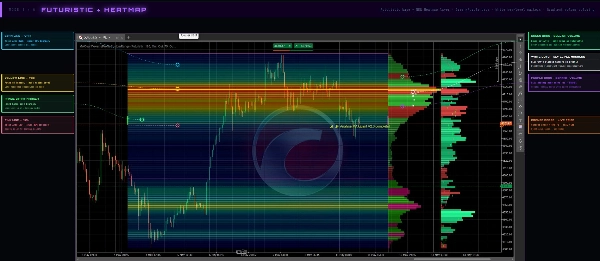
- 📊 Bản đồ Nhiệt Thanh khoản: Trực quan hóa nhiệt các vùng hoạt động cao
- ⚖️ Phân tích Delta Chuyên nghiệp: Cảm nhận người mua/người bán theo thời gian thực
- 📈 Phân tích Đà tích hợp: Phát hiện gia tốc khối lượng
- 🧠 Phát hiện Mẫu tự động: Trí tuệ nhân tạo thị trường
- 🎯 Phiên Đa Thị trường: Châu Á, London, New York, Tùy chỉnh
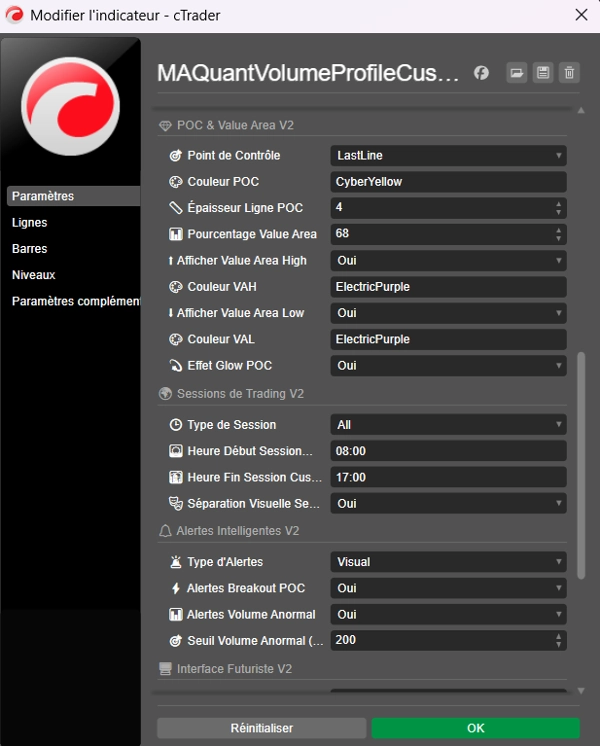
Hệ thống Cảnh báo Thông minh
- 🚨 Cảnh báo Hình ảnh & Âm thanh: Phá vỡ POC và khối lượng bất thường
- ⚡ Ngưỡng Tùy chỉnh: Cấu hình mức kích hoạt
- 📊 Giám sát Thời gian Thực: Theo dõi điều kiện thị trường liên tục
- 🔔 Thông báo Ngay lập tức: Phản ứng tức thì với cơ hội
💎 TÍNH NĂNG CỐT LÕI NÂNG CAO
Hồ sơ Khối lượng Độ chính xác Cao
- 🎯 Vùng Phân tích Tùy chỉnh: Chọn bằng cách nhấp trực quan
- 📏 Lên đến 200 Mức Giá: Độ chi tiết tối đa
- 🔼🔽 Phân tách Khối lượng Tăng/Giảm: Phân tích hướng chính xác
- 📐 Chiều rộng Hồ sơ Điều chỉnh được: Tối ưu vị trí Phải/Trái/Trung tâm
Điểm Kiểm soát Chuyên nghiệp (POC)
- 🎯 POC Phát triển & Dòng cuối: Theo dõi thời gian thực hoặc cố định
- 💫 Hiệu ứng Ánh sáng Neon: Nổi bật hình ảnh nâng cao
- 📏 Độ dày Tùy chỉnh: 1-10 pixel cho khả năng nhìn tối ưu
- ⚡ Cảnh báo Phá vỡ: Thông báo khi vượt mức
Khu vực Giá trị Tổ chức
- 📊 Phần trăm Điều chỉnh được: 0-100% cho các chiến lược cụ thể
- ⬆️ Giá trị Cao (VAH): Kháng cự động
- ⬇️ Giá trị Thấp (VAL): Hỗ trợ động
- 🎨 Màu Chủ đề: Phối hợp hình ảnh hoàn hảo
🎨 PHONG CÁCH HÌNH ẢNH ĐỘT PHÁ
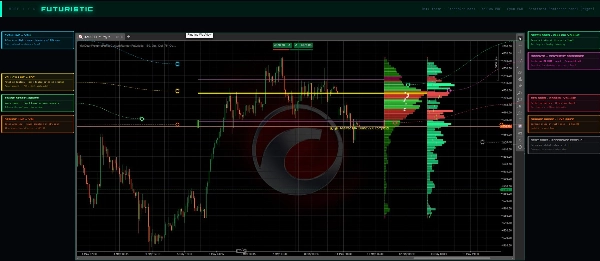
🌟 Tương lai - Mặc định
Giao diện cyberpunk với màu neon và hiệu ứng ánh sáng nâng cao
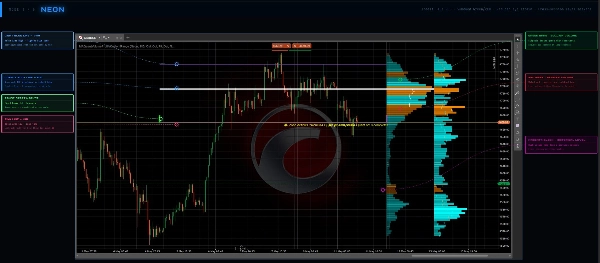
💫 Neon
Phong cách siêu sáng với cường độ tối đa cho giao dịch ban đêm
💼 Chuyên nghiệp
Thiết kế tổ chức với gradient tinh tế và màu sắc doanh nghiệp
🌈 Gradient
Chuyển đổi mượt mà với bảng màu Matrix và hiệu ứng chiều sâu
⚪ Cổ điển
Phong cách sạch sẽ và trang nhã cho môi trường bảo thủ
🛠️ BẢNG ĐIỀU KHIỂN NÂNG CAO
Giao diện Thông minh
- 📊 Chỉ báo Tiến trình Hoạt hình: 4 phong cách (Tuyến tính, Hình tròn, Neon, Matrix)
- 📈 Thống kê Thời gian Thực: Chỉ số hiệu suất tức thì
- 💻 Bảng Điều khiển: Trung tâm điều khiển tất cả tham số
- 🔍 Gỡ lỗi Nâng cao: 3 cấp độ chẩn đoán (Cơ bản, Bình thường, Chi tiết)
Quản lý Phiên
- 🌍 Đa Phiên: Châu Á (00:00-09:00), London (07:00-16:00), NY (13:00-22:00)
- 🕒 Phiên Tùy chỉnh: Định nghĩa thời gian cụ thể
- 🎭 Phân cách Hình ảnh: Phân định rõ ràng các khoảng thời gian
⚡ HIỆU SUẤT & TỐI ƯU HÓA
Tính Toán Hiệu suất Cao
- 🚀 Thuật toán Tối ưu: Xử lý dữ liệu siêu nhanh
- 📊 Phân phối Khối lượng Nâng cao: Phương pháp tính toán chính xác
- 🔄 Cập nhật Thời gian Thực: Tính toán lại động khi điều chỉnh
- 💾 Xuất Dữ liệu: Lưu phân tích để kiểm tra lại
Giao diện Phản hồi
- 🖱️ Kéo & Thả Nâng cao: Điều chỉnh múi giờ trực quan
- ⚡ Hoạt ảnh Mượt mà: 60 FPS cho trải nghiệm cao cấp
- 🎮 Điều khiển Cảm ứng: Giao diện tối ưu cho mọi thiết bị
🎯 ỨNG DỤNG CHUYÊN NGHIỆP
Phân tích Cấu trúc Thị trường
- 🏗️ Hỗ trợ/Kháng cự Động: Mức dựa trên khối lượng thực tế
- 📊 Vùng Xác suất Cao: Xác định khu vực đảo chiều
- 🎯 Điểm Vào Tối ưu: Thời điểm chính xác dựa trên hoạt động tổ chức
Giao dịch Tổ chức
- 💰 Dấu chân Khối lượng Lớn: Theo dõi hoạt động tổ chức
- ⚖️ Mất cân bằng Cung/Cầu: Phân tích Delta để dự đoán chuyển động
- 📈 Đà Cấu trúc Thị trường: Dự đoán phá vỡ dựa trên khối lượng
Quản lý Rủi ro
- 🛡️ Vùng Dừng Lỗ Thông minh: Đặt dựa trên hồ sơ khối lượng
- 🎯 Mục tiêu Định sẵn: Dự báo dựa trên Khu vực Giá trị
- 📊 Kích thước Vị trí Tối ưu: Điều chỉnh dựa trên thanh khoản có sẵn
🏆 ƯU THẾ CẠNH TRANH
✅ Giao diện Thế hệ Mới - Thiết kế tương lai độc đáo trên thị trường
✅ Hiệu suất Tổ chức - Tính toán chính xác cấp độ bàn giao dịch
✅ Tính linh hoạt Toàn diện - 5 phong cách hình ảnh + tùy chỉnh hoàn chỉnh
✅ Cảnh báo Thông minh - Hệ thống phát hiện cơ hội chủ động
✅ Hỗ trợ Đa Phiên - Phân tích toàn cầu 24/7
✅ Cập nhật Thời gian Thực - Thích ứng ngay lập tức với điều kiện thị trường
🔧 CẤU HÌNH ĐƠN GIẢN
Cài đặt Cắm & Chạy
- 📥 Tải xuống Ngay lập tức sau khi mua
- 📁 Cài đặt 1-Click trên nền tảng của bạn
- 🎨 Cấu hình Hướng dẫn với các thiết lập tối ưu
- 🚀 Giao dịch Ngay lập tức với tất cả công cụ nâng cao
BAO GỒM NHỮNG GÌ:
✅ MA Quant Volume Profile V2.0 Phiên bản Tương lai
✅ 5 Phong cách Hình ảnh Hoàn chỉnh
✅ Hệ thống Cảnh báo Nâng cao
✅ Bản đồ Nhiệt Thanh khoản
✅ Phân tích Delta & Đà
✅ Hỗ trợ Đa Phiên
✅ Tài liệu Cao cấp
✅ Cập nhật Trọn đời
✅ Hỗ trợ Kỹ thuật Ưu tiên
🔥 TẠI SAO CHỌN MA QUANT V2.0?
🎯 Giao dịch Chính xác
Thuật toán độc quyền của chúng tôi phân tích phân phối khối lượng với độ chính xác cấp tổ chức, mang lại cho bạn lợi thế cần thiết trong các thị trường cạnh tranh ngày nay.
🚀 Thiết kế Sẵn sàng cho Tương lai
Chỉ số hồ sơ khối lượng được thiết kế cho thế hệ nhà giao dịch tiếp theo. Thẩm mỹ cyberpunk kết hợp với chức năng chuyên nghiệp.
📈 Kết quả Đã được Chứng minh
Được sử dụng bởi các nhà giao dịch chuyên nghiệp trên toàn thế giới, MA Quant V2.0 đã giúp xác định các giao dịch thắng trị giá hàng triệu lợi nhuận tổng hợp.
🛠️ Đổi mới Liên tục
Các bản cập nhật thường xuyên đảm bảo bạn luôn có quyền truy cập vào công nghệ phân tích thị trường và cải tiến hình ảnh mới nhất.
Tóm tắt
Đánh giá của khách hàng
5 | 50 % | |
4 | 50 % | |
3 | 0 % | |
2 | 0 % | |
1 | 0 % |


