
Frac Support Resistance V1
指标
2 购买
版本 1.0, Nov 2025
Windows 版、Mac 版
5.0
评价:1
说明
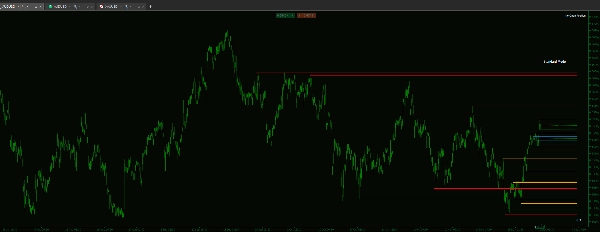
如果您基于市场结构进行交易,您就会知道最关键的水平通常是在更高时间框架上设定的。这个自定义指标解决了手动识别和跟踪这些水平的烦恼。
该工具旨在提供可靠的视觉层次结构,确保您能够看到关键的结构边界,并优先关注高价值区域,而无需离开您的执行屏幕。
主要功能与细粒度控制
- 该指标专为卓越性能和清晰的图表可视化而构建:
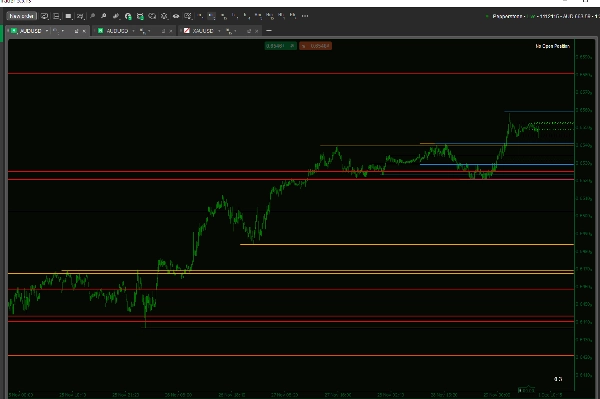
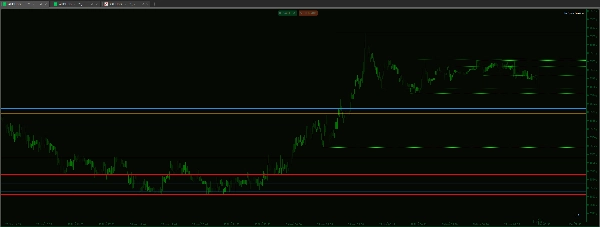
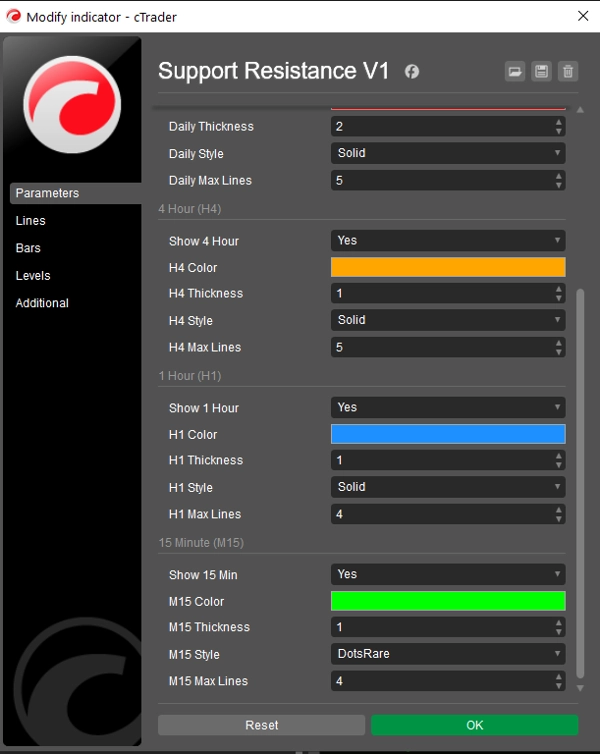
- 真正的视觉层次结构:独立控制每个时间框架的线条粗细、线型(实线、虚线、点线)和颜色。
- 优势:仅凭外观即可立即识别水平的强度(例如,将D1线设置为粗实线以表示主要结构,将H1线设置为细点线以表示即时水平)。
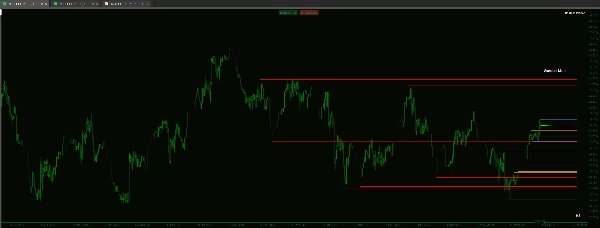
- 性能与焦点控制:厌倦了杂乱的图表?您可以单独限制每个时间框架显示的最大线条数。
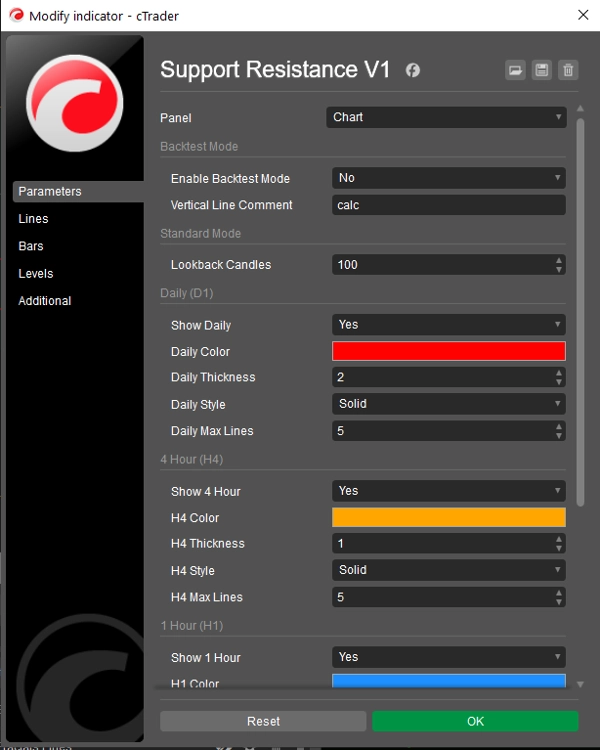
- 示例:将H4最大线条数设置为5,将D1最大线条数设置为15,以优先显示较低时间框架上的近期水平,同时保持对主要结构的更深入视图。
- 干净的代码基础:基于可靠的分形逻辑构建,确保识别的水平是真正用于标准结构分析的高/低枢轴点。
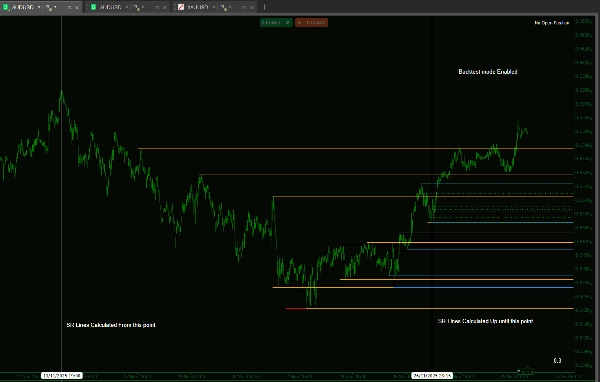
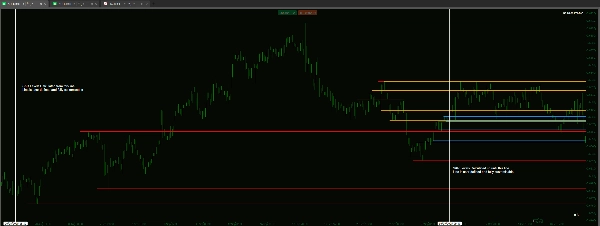
- 专用回测模式:包括一个功能,将指标的分析限制在图表上的特定定义时间范围内。这对于通过模拟时间进展而无未来偏差地进行准确的手动回测至关重要。
摘要
AI 摘要
Frac Support Resistance V1 is a technical indicator designed to automatically calculate and display smart support and resistance lines derived from multiple timeframes: daily (D1), 4-hour (H4), hourly (H1), and 15-minute (M15). It assists traders who rely on market structure by visually highlighting critical price levels established on higher timeframes, reducing the need for manual identification.
Key features include customizable visual hierarchy, allowing independent adjustment of line thickness, style (solid, dashed, dotted), and color for each timeframe. This enables quick recognition of the relative strength of support and resistance levels. Users can also control chart clarity by setting maximum numbers of lines per timeframe to prioritize recent or major structural levels.
The indicator is based on fractal logic to identify genuine high and low pivots consistent with standard market structure analysis. It includes a dedicated backtesting mode that restricts analysis to a specified historical period, facilitating unbiased manual strategy testing by simulating real-time progression.
Frac Support Resistance V1 supports various markets including Forex, cryptocurrencies, commodities, indices, and stocks, with tags indicating compatibility with symbols like BTCUSD, EURUSD, GBPUSD, XAUUSD, NAS100, and USDJPY. The tool is suited for strategies involving breakout, scalping, smart money concepts, and grid trading.
指标配置
客户评价
5.0
评价:1
5 | 100 % | |
4 | 0 % | |
3 | 0 % | |
2 | 0 % | |
1 | 0 % |
客户评价
December 1, 2025
A small account test feels safer, and the plan becomes easier to stick with, and the chart still needs a final look.
讨论
常见问答
BTCUSD
Forex
Signal
Breakout
Indices
EURUSD
Commodities
GBPUSD
NZDUSD
Prop
Scalping
SMC
Crypto
Grid
Stocks
AI
XAUUSD
NAS100
USDJPY
cTrader Store 提供的所有产品,包括交易机器人、指标和插件,均由第三方开发者提供,仅供信息参考和技术访问之用。cTrader Store 并非经纪商,不提供投资建议、个人推荐或任何未来业绩保证。
该作者的其他作品


价格
注册日期 14/01/2025
55
销售
11.5K
免费安装